The $DAYJOB doesn’t afford much opportunity to work with cartographic
datasets, but I really like maps and tinker with shapefiles and
geo-data when I can, plus answer a ton of geo-questions on
StackOverflow. R makes it easy—one might even say too easy—to work
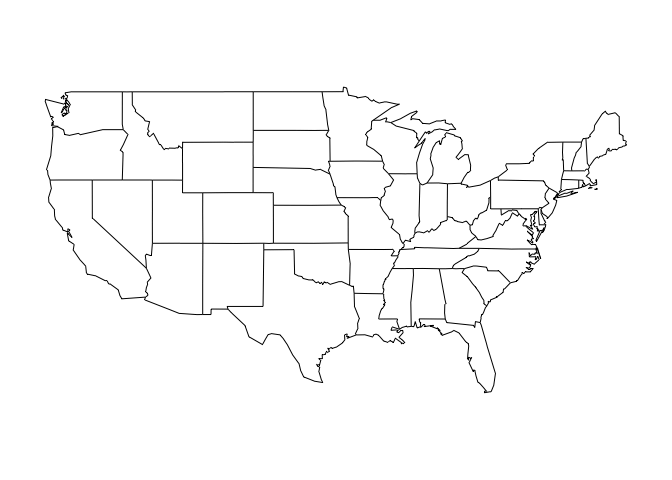
with maps. All it takes to make a map of the continental United States
(CONUS) is:
library(maps) map("state") |
It’s a little more involved with ggplot2:
library(ggplot2) library(ggthemes) states <- map_data("state") gg <- ggplot() gg <- gg + geom_map(data=states, map=states, aes(x=long, y=lat, map_id=region), color="black", fill="white", size=0.25) gg <- gg + theme_map() gg |

Both of those maps are horrible. The maps::map function defaults to
using a rectangular projection with the aspect ratio chosen so that
longitude and latitude scales are equivalent at the center of the
picture. ggplot will size the graphic to the device window. Sticking
with these defaults is a really bad idea. Why? I’ll let Mark Monmonier
(autho or How to Lie with
Maps)
explain:
Maps have three basic attributes: scale, projection, and
symbolization. Each element is a source of distortion. As a group,
they describe the essence of the map’s possibilities and limitations.
No one can use maps or make maps safely and effectively without
understanding map scales, map projections, and map symbols.…
Map projections distort five geographic relationships: areas, angles,
gross shapes, distances, and directions. Although some projections
preserve local angles but not areas, others preserve areas but not
local angles. All distort large shapes noticeably (but some distort
continental shapes more than others), and all distort at least some
distances and some directions.
There are great examples in his book on how map projections can inflate
or diminish the area and relative importance of countries and regions,
and how a map projection can itself become a rallying point for
“cartographically oppressed” regions.
If map projections are important (and they are) what should you do? Both
map and ggplot give you options to use projections that are found in
the mapproj library (specifically using the mapproject function).
The help for mapproject even gives an example of using the Albers
equal-area conic
projection when
plotting the CONUS:
library(mapproj) map("state", projection="albers", par=c(lat0=30, lat1=40)) |

As it’s full name suggests, Albers is as an equal-area projection which
is recommended for U.S. choropleths as it preserves the relative areas
of geographic features. It’s also better than the ggplot default
(“Mercator) in it’s
coord_map:
gg + coord_map() |

But, we can pass in parameters to use a saner projection:
gg + coord_map("albers", lat0=30, lat1=40) |

The mapproject exposes 41 projections which may seem generous, but not
all of them are practical and even the ones with parameters are not very
customizable. Before we dig into that a bit more, you’re probably
wondering (if you don’t work with cartography for a living or hobby) how
one goes about choosing a map projection…
Choosing A Map Projection
Thankfully, many smart folks have thought quite a bit about choosing map
projections and there are a number of resources you can draw upon when
making your own choices.
The first one is Map Projections – A Working
Manual. This is a free
resource from the U.S. Geological Survey and was published back in 1987.
It has a “companion” resource – An Album of Map
Projections. Both are
outstanding resources to have on hand as they provide a great deal of
information on map projections. If you’re in a hurry, the “Album” makes
for a good quick reference. Here’s the entry for our buddy Albers:

(Go to page 10 of the “Album” for the larger version)
The image in the upper-right is a “Tissot indicatrix” (named for it’s
creator Nicolas Auguste Tissot), which “puts Tissot indicatrices at
every 30° of latitude and longitude, except at the poles. This shows the
shape of infinitesimally small circles on the Earth as they appear when
they are plotted by using a fixed finite scale at the same locations on
a map. Every circle is plotted as a circle or an ellipse or, in extreme
cases, as a straight line. On an equal-area projection, all these
ellipses and circles are shown as having the same area. The flattening
of the ellipse shows the extent of local shape distortion and how much
the scale is changed and in what direction. On conformal map
projections, all indicatrices remain circles, but the areas change. On
other projections, both the areas and the shapes of the indicatrices
change”. This makes for a great way to understand just how your
creations are being distorted (though that may be obvious when you
actually plot your maps).
The “Working Manual” also includes the equations necessary to compute
the projections. Both provide projection usage guidance as well as the
technicaly bits describing them.
The Institute for Environment and
Sustainability has a similar
guide for Map Projections for
Europe.
Many countries and municipalities also have their own guides for using
projections (e.g.
California).
If you can handle what feels like a TARDIS trip back in time to the days
of GeoCities, MapRef also provides
good information on projections. You can also review Carlos A. Furuti’s
compilation
of projections for more information.
Using More Complex/Nuanced Projections
Despite being able to use Albers and 40 other projections via
mapproject, having more flexibility would allow us to use grid systems
(see the refs in the previous section for what those are) and also
hyper-customize many projections without the need to write our own
equations (be thankful of that as you skim the math in the “Working
Manual”!).
Gerald Evenden developed a library and utility called proj for the
USGS back in 1995 and said utility, library & projection specification
idiom has been maintained and expanded ever since in the PROJ.4
project. This library/tool is
straightforward to install on most (if not all) operating systems.
PROJ.4 lets you specify projections in a (fairly complex) string format
(often referred to as a proj4string, especially in R). For example,
you can specify Albers for the U.S. with:
"+proj=aea +lat_1=29.5 +lat_2=45.5 +lat_0=37.5 +lon_0=-96"
|
Cartographic Projection Procedures for the UNIX Environment—A User’s
Manual (considered “the”
manual for PROJ.4) explains how to build the specification. At the time
of this blog post there are 134 named (i.e. +proj=NAME) projections
availble for use & customization (run proj -l at a command-line to see
the full list).
A simple example of why this is useful is when you need to plot a world
map. Said activity should always be prefaced with a review of this
seminal work so you will choose a good
projection—say, Winkel-Tripel. A quick glance of what mapproject
supports will show you that you’re pretty much out of luck using the
standard R tools we’ve seen so far for that but there is a handy
+proj=wintri in PROJ.4 we can use.
Here’s how you’d plot that projection in the base plotting system:
library(sp) library(rworldmap) # this pkg has waaaay better world shapefiles plot(spTransform(getMap(), CRS("+proj=wintri"))) |

However, we can’t pass in PROJ.4 strings to ggplot’s coord_map, so we
have to project the Earth first before plotting and use
coord_equal:
world <- fortify(spTransform(getMap(), CRS("+proj=wintri"))) gg <- ggplot() gg <- gg + geom_map(data=world, map=world, aes(x=long, y=lat, map_id=id), color="black", fill="white", size=0.25) gg <- gg + coord_equal() gg <- gg + theme_map() gg |

While that works, you have to pre-project any lines, points, etc. as
well before plotting them with the map. For example, here are the
locations of all of the non-military rocket launch sites (yeah, I’ve done that before, but it’s a fun data set! – and I had it handy):
library(rgdal) # for readOGR library(httr) # for downloading launch_sites <- paste0("https://collaborate.org/sites/collaborate.org/", "files/spacecentersnon-militaryspacelaunchsites.kml") invisible(try(GET(launch_sites, write_disk("/tmp/launch-sites.kml")), silent=TRUE)) sites <- readOGR("/tmp/launch-sites.kml", "SpaceCenters: Non-Military Space Launch Sites", verbose=FALSE) sites_wt <- spTransform(sites, CRS("+proj=wintri")) sites_wt <- coordinates(sites_wt) gg <- gg + geom_point(data=as.data.frame(sites_wt), aes(x=coords.x1, y=coords.x2), color="#b2182b") gg |

If you have more layers, that’s doable, but painful. If we could make it
so ggplot allow for PROJ.4 projections in some coord_ this would help
keep our plot idioms (and code) cleaner. Thus, coord_proj was born.
coord_proj mimics the functionality of coord_map but uses
proj4::project instead of mapproject (and takes in any of those
parameters). The world map with launch sites now looks like this
(complete ggplot code):
world <- fortify(getMap()) sites <- as.data.frame(coordinates(readOGR("/tmp/launch-sites.kml", "SpaceCenters: Non-Military Space Launch Sites", verbose=FALSE))) gg <- ggplot() gg <- gg + geom_map(data=world, map=world, aes(x=long, y=lat, map_id=id), color="black", fill="white", size=0.25) gg <- gg + geom_point(data=(sites), aes(x=coords.x1, y=coords.x2), color="#b2182b") gg <- gg + coord_proj("+proj=wintri") gg <- gg + theme_map() gg |

Now, if you want to go all Hobo-Dyer instead of Winkel-Tripel, it’s
one, small change:
gg + coord_proj("+proj=cea +lat_ts=37.5") |

Spatial Reference is a website by Howard
Butler, Christopher Schmidt, Dane Springmeyer, and Josh Livni that helps
assist others in their understanding, recording, and usage of spatial
reference systems. It’s ultimate goal is to let you use URI’s to specify
spatial reference systems, but you can use it to lookup Proj4 strings to
meet virtually any need you have.
The Bad News
Presently, coord_proj is not part of the ggplot2 code base. I chose
a really bad time to muck with this as Hadley is doing all sorts of
spiffy stuff to ggplot2 and it’s not a good time to shove this in there.
You can fork your own copy of ggplot2 from Hadley’s GitHub
repo and add this
file to it,
re-document/collate/build the package and then use it locally. It still
needs some work (there’s a horrible hack in it that anyone familiar with
geo-stuff will cringe at) but I welcome feedback/contributions.
Hopefully this will get into ggplot2 (or out of it and into a separate
package since Hadley is making ggplot2 very extensible in his update) at
some point in the not-too-distant future.
R-bloggers.com offers daily e-mail updates about R news and tutorials on topics such as: visualization (ggplot2, Boxplots, maps, animation), programming (RStudio, Sweave, LaTeX, SQL, Eclipse, git, hadoop, Web Scraping) statistics (regression, PCA, time series, trading) and more...