Quantcast
Channel: Search Results for “how to import image file to r”– R-bloggers
Viewing all 321 articles
Browse latest View live

Bivariate Linear Regression

$
0
0

(This article was first published on DataScience+, and kindly contributed to R-bloggers)

Regression is one of the – maybe even the single most important fundamental tool for statistical analysis in quite a large number of research areas. It forms the basis of many of the fancy statistical methods currently en vogue in the social sciences. Multilevel analysis and structural equation modeling are perhaps the most widespread and most obvious extensions of regression analysis that are applied in a large chunk of current psychological and educational research. The reason for this is that the framework under which regression can be put is both simple and flexible. Another great thing is that it is easy to do in R and that there are a lot – a lot – of helper functions for it.

Let’s take a look at an example of a simple linear regression. I’ll use the swiss dataset which is part of the datasets-Package that comes pre-packaged in every R installation. To load it into your workspace simply use

data(swiss)

As the helpfile for this dataset will also tell you, its Swiss fertility data from 1888 and all variables are in some sort of percentages. The outcome I’ll be taking a look at here is the Fertility indicator as predictable by the education beyond primary school – my basic assumption being that higher education will be predictive of lower fertility rates (if the 1880s were anything like today).

First, lets take a look at a simple scatterplot:

plot(swiss$Fertility~swiss$Education)

Scatterplot:
Scatterplot

The initial scatterplot already suggests some support for the assumption and – more importantly – the code for it already contains the most important part of the regression syntax. The basic way of writing formulas in R is dependent ~ independent. The tilde can be interpreted as “regressed on” or “predicted by”. The second most important component for computing basic regression in R is the actual function you need for it: lm(...), which stands for “linear model”.

The two arguments you will need most often for regression analysis are the formula and the data arguments. These are incidentally also the first two of the lm(...)-function. Specifying the data arguments allows you to include variables in the formula without having to specifically tell R where each of the variables is located. Of course, this only works if both variables are actually in the dataset you specify. Let’s try it and assign the results to an object called reg

reg <- lm(Fertility~Education,swiss)
reg
Call:
lm(formula = Fertility ~ Education, data = swiss)

Coefficients:
(Intercept)    Education  
    79.6101      -0.8624 

The basic output of the lm(...) function contains two elements: the Call and the Coefficients. The former is used to tell you what regression it was that you estimated – just to be sure – and the second contains the regression coefficients. In this case there are two coefficients: the intercept and the regression weight of our sole predictor. What this tells us is that for a province with an educational value of 0 a fertility value of 79.61 is predicted. This is often also called a condtional expectation because it is the value you expect for the dependent variable under the condition that the independent variable is 0. Put a bit more formally: E(Y|X=0) = 79.61. The regression weight is the predicted difference between two provinces that differ in education by a single point.

Like for most R objects, the summary-function shows the most important information in a nice ASCII table.

summary(reg)
Call:
lm(formula = Fertility ~ Education, data = swiss)

Residuals:
    Min      1Q  Median      3Q     Max 
-17.036  -6.711  -1.011   9.526  19.689 

Coefficients:
            Estimate Std. Error t value Pr(>|t|)    
(Intercept)  79.6101     2.1041  37.836  < 2e-16 ***
Education    -0.8624     0.1448  -5.954 3.66e-07 ***
---
Signif. codes:  0 ‘***’ 0.001 ‘**’ 0.01 ‘*’ 0.05 ‘.’ 0.1 ‘ ’ 1

Residual standard error: 9.446 on 45 degrees of freedom
Multiple R-squared:  0.4406,	Adjusted R-squared:  0.4282 
F-statistic: 35.45 on 1 and 45 DF,  p-value: 3.659e-07

What is the most important information in this table? Most probably the coefficients-section, which contains the parameter estimates and their corresponding t-tests. This shows us that the education level in a province is significantly related to the fertility rate in.

The second most important line is the one containing the R^2. In this case over 44% of the provincial variability in fertility is shared with the variability in the educational level. Due to the fact that the R^2 is the squared multiple correlation between the dependent and all independent variables the square of the Pearson-Correlation the correlation between fertility and education should be exactly equal to the R^2 we found here. To check this, we can use

summary(reg)$r.squared
cor(swiss$Fertility,swiss$Education)^2
summary(reg)$r.squared == cor(swiss$Fertility,swiss$Education)^2
0.4406156
0.4406156
TRUE

The last line of this code performs the logical check for identity of the two numbers.

To wrap up, we’ll add the regression line to the scatterplot we generated at the beginning of this post. As noted, the lm(...)-function and its results are extremely well embedded in the R environment. So all we need to add the resulting regression line is the abline(...)-function. This function can be used to add any line which can be described by an intercept (a) and a slope (b). If you provide an object of the lm-class, the regression line will be drawn for you.

plot(swiss$Fertility~swiss$Education)
abline(reg)

Regression line:
scatter_reg

This wraps up the very basic introduction to linear regression in R. In future post we’ll extend these concepts to multiple regression and take a look at how to easily check for the assumptions made in OLS regression.

To leave a comment for the author, please follow the link and comment on his blog: DataScience+.

R-bloggers.com offers daily e-mail updates about R news and tutorials on topics such as: visualization (ggplot2, Boxplots, maps, animation), programming (RStudio, Sweave, LaTeX, SQL, Eclipse, git, hadoop, Web Scraping) statistics (regression, PCA, time series, trading) and more...

Yet another post on google scholar data analysis

$
0
0

(This article was first published on tuxette-chix » R, and kindly contributed to R-bloggers)

Inspired by this post, I wanted to use Google Scholar data to put nice images on my professional website (girly habit). This post explains how I combined the functions available in the R package scholar with additional analyses (partially inspired from the script available at this link, which in my case results in a cannot open the connection error message) to generate a few informative graphics.

Get a summary of all publications

Using the function get_publications in the package scholar, you can obtain a summary (title, authors, journal, volume and issue numbers, number of citations, year and google scholar ID) of all the paper a given author has published. However, the default publication displayed on the first page of an author’s google scholar profile is 20 so the function only returns the first 20 citations. A solution could have been to modify the package’s function to add a &pagesize=1000 (supposing that the author has less than 1000 publications, which seems reasonable enough) in the parsed URL. I chose a slightly different method, directly using the package function and that relies on the use of the argument cstart which tells from which citation the data acquisition should start. Hence, looping over this argument, we can retrieve all publications, 20 at each call of the function:

get_all_publications = function(authorid) {
  # initializing the publication list
  all_publications = NULL
  # initializing a counter for the citations
  cstart = 0
  # initializing a boolean that check if the loop should continue
  notstop = TRUE
 
  while (notstop) {
    new_publications = try(get_publications(my_id, cstart=cstart), silent=TRUE)
    if (class(new_publications)=="try-error") {
      notstop = FALSE
    } else {
      # append publication list
      all_publications = rbind(all_publications, new_publications)
      cstart=cstart+20
    }
  }
  return(all_publicationss)
}

In my case, the use of this function gives:

library(scholar)
my_id = "MY GOOGLE SCHOLAR ID"
all_publications = get_all_publications(my_id)
dim(all_publications)
# [1] 122   8
table(all_publications$year)
# 2004 2005 2006 2007 2008 2009 2010 2011 2012 2013 2014 2015 
     1    4    7    7    8    9    7    9   12   11   18    7 
summary(all_publications$cites)
#    Min. 1st Qu.  Median    Mean 3rd Qu.    Max. 
#   0.000   0.000   0.000   5.566   5.000 140.000

Find all co-authors

From the previously obtained publication list, we can also retrieve all co-authors. This is done by using the column author and by splitting it on the character “, “. Additionally, for long authorship lists, the author "..." has also to be removed (which biases a bit the list actually…):

get_all_coauthors = function(my_id, me=NULL) {
  all_publications = get_all_publications(my_id)
  if (is.null(me))
    me = strsplit(get_profile(my_id)$name, " ")[[1]][2]
  # make the author list a character vector
  all_authors = sapply(all_publications$author, as.character)
  # split it over ", "
  all_authors = unlist(sapply(all_authors, strsplit, ", "))
  names(all_authors) = NULL
  # remove "..." and yourself
  all_authors = all_authors[!(all_authors %in% c("..."))]
  all_authors = all_authors[-grep(me, all_authors)]
  # make a data frame with authors by decreasing number of appearance
  all_authors = data.frame(name=factor(all_authors, 
    levels=names(sort(table(main_authors),decreasing=TRUE))))
}

The argument me is used to remove yourself from your own co-authorship list. By default, it will use your family name as recorded in your google scholar profile (if your family name is the second word of your whole name). In my case, I used two names in my publications so manually provided the argument:

all_authors = get_all_coauthors(my_id, me="PART OF MY NAME")

After a bit of cleaning up (removing co-authors who are only cited once, fixing some encoding issues…), I obtained the following image:
co-authors
with (among other commands for cleaning up the data a bit):

main_authors = all_authors[all_authors$name %in% names(which(table(all_authors$name)>1))]
library(ggplot2)
p = ggplot(main_authors, aes(x=name) + geom_bar(fill=brewer.pal(3, "Set2")[2]) +
  xlab("co-author") + theme_bw() + theme(axis.text.x = element_text(angle=90, hjust=1))
print(p)

Analysis of the words in the abstracts

Finally, looping over the publication IDs, we can retrieve all the abstracts of the publication list to make a basic text mining analysis. To do so, I used the package XML which provides many functions for web scraping. I first defined a function to get one article’s abstract from its google ID (and the author’s google ID):

get_abstract = function(pub_id, my_id) {
  print(pub_id)
  paper_url = paste0("http://scholar.google.com/citations?view_op=view_citation&hl=fr&user=",
                     my_id, "&citation_for_view=", my_id,":", pub_id)
  paper_page = htmlTreeParse(paper_url, useInternalNodes=TRUE, encoding="utf-8")
  paper_abstract = xpathSApply(paper_page, "//div[@id='gsc_descr']", xmlValue)
  return(paper_abstract)
}

Then, looping over the data frame all_publications that have been previously retrieved from google scholar, we obtain the list of all abstracts.

get_all_abstracts = function(my_id) {
  all_publications = get_all_publications(my_id)
  all_abstracts = sapply(all_publications$pubid, get_abstract)
  return(all_abstracts)
}

Then, the package tm is used to obtain a publication/term matrix and finally a term frequency matrix that can be processed with the package wordcloud to obtain
co-authors

library(XML)
all_abstracts = get_all_abstracts(my_id)
library(tm)
# transform the abstracts into "plan text documents"
all_abstracts = lapply(all_abstracts, PlainTextDocument)
# find term frequencies within each abstract
terms_freq = lapply(all_abstracts, termFreq, 
                    control=list(removePunctuation=TRUE, stopwords=TRUE, removeNumbers=TRUE))
# finally obtain the abstract/term frequency matrix
all_words = unique(unlist(lapply(terms_freq, names)))
matrix_terms_freq = lapply(terms_freq, function(astring) {
  res = rep(0, length(all_words))
  res[match(names(astring), all_words)] = astring
  return(res)
})
matrix_terms_freq = Reduce("rbind", matrix_terms_freq)
colnames(matrix_terms_freq) = all_words
# deduce the term frequencies
words_freq = apply(matrix_terms_freq, 2, sum)
# keep only the most frequent and after a bit of cleaning up (not shown) make the word cloud
important = words_freq[words_freq > 10]
library(wordcloud)
wordcloud(names(important), important, random.color=TRUE, random.order=TRUE,
          color=brewer.pal(12, "Set3"), min.freq=1, max.words=length(important), scale=c(3, 0.3))

To leave a comment for the author, please follow the link and comment on his blog: tuxette-chix » R.

R-bloggers.com offers daily e-mail updates about R news and tutorials on topics such as: visualization (ggplot2, Boxplots, maps, animation), programming (RStudio, Sweave, LaTeX, SQL, Eclipse, git, hadoop, Web Scraping) statistics (regression, PCA, time series, trading) and more...

R, Python, and SAS: Getting Started with Linear Regression

$
0
0

(This article was first published on Analysis with Programming, and kindly contributed to R-bloggers)
Consider the linear regression model, $$ y_i=f_i(boldsymbol{x}|boldsymbol{beta})+varepsilon_i, $$ where $y_i$ is the response or the dependent variable at the $i$th case, $i=1,cdots, N$ and the predictor or the independent variable is the $boldsymbol{x}$ term defined in the mean function $f_i(boldsymbol{x}|boldsymbol{beta})$. For simplicity, consider the following simple linear regression (SLR) model, $$ y_i=beta_0+beta_1x_i+varepsilon_i. $$ To obtain the (best) estimate of $beta_0$ and $beta_1$, we solve for the least residual sum of squares (RSS) given by, $$ S=sum_{i=1}^{n}varepsilon_i^2=sum_{i=1}^{n}(y_i-beta_0-beta_1x_i)^2. $$ Now suppose we want to fit the model to the following data, Average Heights and Weights for American Women, where weight is the response and height is the predictor. The data is available in R by default.

The following is the plot of the residual sum of squares of the data base on the SLR model over $beta_0$ and $beta_1$, note that we standardized the variables first before plotting it,

Error Surface

If you are interested on the codes of the above figure, please click here. To minimize this elliptic paraboloid, differentiation has to be done with respect to the parameters, and then equate this to zero to obtain the stationary point, and finally we solve for $beta_0$ and $beta_1$. For more on derivation of the estimates of the parameters see reference 1.


Simple Linear Regression in R

In R, we can fit the model using the function lm, which stands for linear model, i.e.

Formula, defined above as {response ~ predictor}, is a handy method for fitting model to the data in R. Mathematically, our model is $$ weight = beta_0 + beta_1 (height) + varepsilon. $$ The summary of it is obtain by running model %>% summary or for non-magrittr user summary(model), given the model object defined in the previous code,

The Coefficients section above returns the estimated coefficients of the model, and these are $beta_0 = -87.51667$ and $beta_1=3.45000$ (it should be clear that we used the unstandardized variables for obtaining these estimates). The estimates are both significant base on the p-value under .05 and even in .01 level of the test. Using the estimated coefficients along with the residual standard error we can now construct the fitted line and it’s confidence interval as shown below.

Fig 1. Plot of the Data and the Predicted Values in R.


Simple Linear Regression in Python

In Python, there are two modules that have implementation of linear regression modelling, one is in scikit-learn (sklearn) and the other is in Statsmodels (statsmodels). For example we can model the above data using sklearn as follows:

Above output is the estimate of the parameters, to obtain the predicted values and plot these along with the data points like what we did in R, we can wrapped the functions above into a class called linear_regression that requires Seaborn package for neat plotting, see the codes below:

Using this class and its methods, fitting the model to the data is coded as follows:

The predicted values of the data points is obtain using the predict method,

And Figure 2 below shows the plot of the predicted values along with its confidence interval and data points.

Fig 2. Plot of the Data and the Predicted Values in Python.

If one is only interested on the estimates of the model, then LinearRegression of scikit-learn is sufficient, but if the interest in other statistics returned in R model summary is necessary, the said module can also do the job but might need to program other necessary routine. statsmodels, on the other hand, returns complete summary of the fitted model as compared to the R output above, which is useful for studies with particular interest on these information. So that modelling the data using simple linear regression is done as follows:

Clearly, we could spare time with statsmodels, especially in diagnostic checking involving test statistics such as Durbin-Watson and Jarque-Bera tests. We could of course add some plotting for diagnostic, but I prefer to discuss that on a separate entry.


Simple Linear Regression in SAS

Now let’s consider running the data in SAS, I am using SAS Studio and in order to import the data, I saved it as a CSV file first with columns height and weight. Uploaded it to SAS Studio, in which follows are the codes below to import the data.

Next we fit the model to the data using the REG procedure,


Number of Observations Read 15
Number of Observations Used 15
Analysis of Variance
Source DF Sum of
Squares
Mean
Square
F Value Pr > F
Model 1 3332.70000 3332.70000 1433.02 <.0001
Error 13 30.23333 2.32564    
Corrected Total 14 3362.93333      
Root MSE 1.52501 R-Square 0.9910
Dependent Mean 136.73333 Adj R-Sq 0.9903
Coeff Var 1.11531    
Parameter Estimates
Variable DF Parameter
Estimate
Standard
Error
t Value Pr > |t|
Intercept 1 -87.51667 5.93694 -14.74 <.0001
height 1 3.45000 0.09114 37.86 <.0001

Now that’s a lot of output, probably the complete one. But like I said, I am not going to discuss each of these values and plots as some of it are used for diagnostic checking (you can read more on that in reference 1, and other applied linear regression books). For now, let’s just confirm the coefficients obtained — both the estimates are the same with that in R and Python.


Multiple Linear Regression (MLR)

To extend SLR to MLR, we’ll demonstrate this by simulation. Using the formula-based lm function of R, assuming we have $x_1$ and $x_2$ as our predictors, then following is how we do MLR in R:

Although we did not use intercept in simulating the data, but the obtained estimates for $beta_1$ and $beta_2$ are close to the true parameters (.35 and .56). The intercept, however, will help us capture the noise term we added in simulation.

Next we’ll try MLR in Python using statsmodels, consider the following:

It should be clear that the estimates in R and in Python, should not (necessarily) be the same since these are simulated values from different software. Finally, in SAS we have


Number of Observations Read 100
Number of Observations Used 100
Analysis of Variance
Source DF Sum of
Squares
Mean
Square
F Value Pr > F
Model 2 610.86535 305.43268 303.88 <.0001
Error 97 97.49521 1.00511    
Corrected Total 99 708.36056      
Root MSE 1.00255 R-Square 0.8624
Dependent Mean 244.07327 Adj R-Sq 0.8595
Coeff Var 0.41076    
Parameter Estimates
Variable DF Parameter
Estimate
Standard
Error
t Value Pr > |t|
Intercept 1 18.01299 11.10116 1.62 0.1079
X1 1 0.31770 0.01818 17.47 <.0001
X2 1 0.58276 0.03358 17.35 <.0001


Conclusion

In conclusion, all software have consistent estimates on the parameters. SAS in particular saves a lot of work, since it returns complete summary of the model, no doubt why companies prefer to use this, besides from their active customer support. R and Python, on the other hand, despite the fact that it is open-source, it can well compete with the former software, although it requires programming skills to achieved all of the SAS outputs, but I think that’s the exciting part of it, it makes you think and manage time. If successful, the achievement is of course fulfilling. Hope you’ve learned something, feel free to share your thoughts on the comment below.


Reference

  1. Draper, N. R. and Smith, H. (1966). Applied Regression Analysis. John Wiley & Sons, Inc. United States of America.
  2. Scikit-learn Documentation
  3. Statsmodels Documentation
  4. SAS Documentation
  5. Delwiche, Lora D., and Susan J. Slaughter. 2012. The Little SAS® Book: A Primer, Fifth Edition. Cary, NC: SAS Institute Inc.
  6. Regression with SAS. Institute for Digital Research and Education. UCLA. Retrieved August 13, 2015.
  7. Python Plotly Documentation

To leave a comment for the author, please follow the link and comment on his blog: Analysis with Programming.

R-bloggers.com offers daily e-mail updates about R news and tutorials on topics such as: visualization (ggplot2, Boxplots, maps, animation), programming (RStudio, Sweave, LaTeX, SQL, Eclipse, git, hadoop, Web Scraping) statistics (regression, PCA, time series, trading) and more...

Some reflections on teaching frequentist statistics at ESSLLI 2015

$
0
0

(This article was first published on Shravan Vasishth's Slog (Statistics blog), and kindly contributed to R-bloggers)

I spent the last two weeks teaching frequentist and Bayesian statistics at the European Summer School in Logic, Language, and Information (ESSLLI) in Barcelona, at the beautiful and centrally located Pompeu Fabra University. The course web page for the first week is here, and the web page for the second course is here. (NOTE: Uni Potsdam servers are currently down, but will go up soon, hopefully; that’s where all the course materials are).

All materials are available on github, see here

The frequentist course went well, but the Bayesian course was a bit unsatisfactory; perhaps my greater experience in teaching the frequentist stuff played a role (I have only taught Bayes for three years).  I’ve been writing and rewriting my slides and notes for frequentist methods since 2002, and it is only now that I can present the basic ideas in five 90 minute lectures; with Bayes, the presentation is more involved and I need to plan more carefully, interspersing on-the-spot exercises to solidify ideas. I will comment on the Bayesian Data Analysis course in a subsequent post.

The first week (five 90 minute lectures) covered the basic concepts in frequentist methods. The audience was amazing; I wish I always had students like these in my classes. They were attentive, and anticipated each subsequent development. This was the typical ESSLLI crowd, and this is why teaching at ESSLLI is so satisfying. There were also several senior scientists in the class, so hopefully they will go back and correct the misunderstandings among their students about what all this Null Hypothesis Significance Testing stuff gives you (short answer: it answers *a* question very well, but it’s the wrong question, nothing that is relevant to your research question).

I won’t try to summarize my course, because the web page is online and you can also do exercises on datacamp to check your understanding of statistics (see here). You get immediate feedback on your solution. NOTE: the Potsdam server seems to be down (the sys admin is on holiday, and when he goes away, everything immediately breaks down, regular as clockwork).

Stepping away from the technical details, I tried to make three broad points:

First, I spent a lot of time trying to clarify what a p-value is and isn’t, focusing particularly on the issue of Type S and Type M errors, which Gelman and Carlin have discussed in their excellent paper.

 Here is the way that I visualized the problems of Type S and Type M errors:

What we see here is repeated samples from a Normal distribution with true mean 15 and a typical standard deviation seen in psycholinguistic studies (see slide 42 of my slides for lecture2). The horizontal red line marks the 20% power line; most psycholinguistic studies fall below that line in terms of power. The dramatic consequence of this low power is the hugely exaggerated effects (which tend to get published in major journals because they also have low p-values) and the remarkable proportion of cases where the sample mean is on the wrong side of the true value 15. So, you are roughly equally likely to get a significant effect with a sample mean smaller to much smaller than the true mean, or larger and much larger than the true mean. With low power, regardless of whether you get a significant result or not, if power is low, and it is in most studies I see in journals, you are just farting in a puddle.

It is worth repeating this: once one considers Type S and Type M errors, even statistically significant results become irrelevant, if power is low.  It seems like these ideas are forever going to be beyond the comprehension of researchers in linguistics and psychology, who are trained to make binary decisions based on p-values, weirdly accepting the null if p is greater than 0.05 and, just as weirdly, accepting their favored alternative if  p is less than 0.05. The p-value is a truly interesting animal; it seems that a recent survey of some 400 Spanish psychologists found that, despite their being active in the field for quite a few years on average, they had close to zero understanding of what a p-value gives you. Editors of top journals in psychology routinely favor lower p-values, because they mistakenly think this makes “the result” more convincing; “the result” is the favored alternative.  So even seasoned psychologists (and I won’t even get started with linguists, because we are much, much worse), with decades of experience behind them, often have no idea what the p-value actually tells you.

A remarkable misunderstanding regarding p-values is the claim that it tells you whether the effect was “by chance”. Here is an example from Replication Index’s blog:

“The Test of Insufficient Variance (TIVA) shows that the variance in z-scores is less than 1, but the probability of this event to occur by chance is 10%, Var(z) = .63, Chi-square (df = 11) = 17.43, p = .096.”
 
Even people explaining p-values in publications are unable to understand that this is completely false. It is no wonder that the poor psychologist/linguist thinks, ok, if the p-value is telling me the probability that the effect is due to chance, and if the p-value is low, then the effect is not due to chance and the effect must be true. The mistake here is that the p-value is telling you the probability of getting the statistic (e.g., t-value) or something more extreme, under the assumption that the null hypothesis is true. People seem to forget or drop the italicized part and this starts to propagate the misunderstanding for future generations. The p-value is a conditional probability, but most people interpret it as an unconditional probability.

Another bizarre thing I have repeatedly seen is misinterpreting the p-value as Type I error. Type I error is fixed at a particular value (0.05) before you run the experiment, and is the probability of your incorrectly rejecting the null when it’s true, under repeated sampling. The p-value is what you get from your single experiment and is the conditional probability of your getting the statistic you got or something more extreme, assuming that the null is true. Even this point is beyond comprehension for psychologists (and of course linguists). Here is a bunch of psychologists explaining in an article why a p=0.0000 should not be reported as an exact value:

“p = 0.000. Even though this statistical expression, used in over 97,000 manuscripts according to Google Scholar, makes regular cameo appearances in our computer printouts, we should assiduously avoid inserting it in our Results sections. This expression implies erroneously that there is a zero probability that the investigators have committed a Type I error, that is, a false rejection of a true null hypothesis (Streiner, 2007). That conclusion is logically absurd, because unless one has examined essentially the entire population, there is always some chance of a Type I error, no matter how meager. Needless to say, the expression “p < 0.000” is even worse, as the probability of committing a Type I error cannot be less than zero. Authors whose computer printouts yield significance levels of p = 0.000 should instead express these levels out to a large number of decimal places, or at least indicate that the probability level is below a given value, such as p < 0.01 or p < 0.001.”

The p-value is the probability of committing a Type I error, eh? It is truly embarrassing that people who are teaching this stuff have distorted the meaning of the p-value so drastically and just keep propagating the error. I should mention though that this paper I am citing appeared in Frontiers, which I am beginning to question as a worthwhile publication venue. Who did the peer review on this paper and why did they not catch this basic mistake?

Even Fisher (p. 16 of The Design of Experiments, Second Edition, 1937) didn’t buy the p-value; he is advocating for replicability as the real decisive tool:

“It is usual and convenient for experimenters to take-5 per cent. as a standard level of significance, in the sense that they are prepared to ignore all results which fail to reach this standard, and, by this means, to eliminate from further discussion the greater part of the fluctuations which chance causes have introduced into their experimental results. No such selection can eliminate the whole of the possible effects of chance. coincidence, and if we accept this convenient convention, and agree that an event which would occur by chance only once in 70 trials is decidedly” significant,” in the statistical sense, we thereby admit that no isolated experiment, however significant in itself, can suffice for the experimental demonstration of any natural phenomenon; for the “one chance in a million” will undoubtedly occur, with no less and no more than its appropriate frequency, however surprised we may be that it should occur to us. In order to assert that a natural phenomenon is experimentally demonstrable we need, not an isolated record, but a reliable method of procedure. In relation to the test of significance, we may say that a phenomenon is experimentally demonstrable when we know how to conduct an experiment which will rarely fail to give us a statistically significant result.”

Second, I tried to clarify what a 95% confidence interval is and isn’t. At least a couple of students had a hard time accepting that the 95% CI refers to the procedure and not that the true $mu$ lies within one specific interval with probability 0.95, until I pointed out that $mu$ is just a point value and doesn’t have a probability distribution associated with it.  Morey and Wagenmakers and Rouder et al have been shouting themselves hoarse about confidence intervals, and how many people don’t understand them, also see this paper. Ironically, psychologists have responded to these complaints through various media, but even this response only showcases how psychologists have only a partial and misconstrued understanding of confidence intervals. I feel that part of the problem is that scientists hate to back off from a position they have taken, and so they tend to hunker down and defend defend defend their position. From the perspective of a statistician who understands both Bayes and frequentist positions, the conclusion would have to be that Morey et al are right, but for large sample sizes, the difference between a credible interval and a confidence interval (I mean the actual values that you get for the lower and upper bound) are negligible. You can see examples in our recently ArXiv’d paper.

Third, I tried to explain that there is a cultural difference between statisticians on the one hand and (most) psychologists and almost all psychologist, linguists, etc. on the other.  For the latter group (with the obvious exception of people using Bayesian methods for data analysis), the whole point of fitting a statistical model is to do a hypothesis test, i.e., to get a p-value out of it.  They simply do not care what the assumptions and internal moving parts of a t-test or a linear mixed model are. I know lots of users of lmer who are focused on one and only one thing: is my effect significant? I have repeatedly seen experienced experimenters in linguistics simply ignoring the independence assumption of data points when doing a paired t-test; people often do paired t-tests on unaggregated data, with multiple rows of data points for each subject (for example). This leads to spurious significance effects, which they happily and unquestioningly accept because that was the whole goal of the exercise. I show some examples in my lecture2 slides (slide 70).

It’s not just linguists, you can see the consequences of ignoring the independence assumption in this reanalysis of the infamous study on how future tense marking in language supposedly influences economic decisions.  Once the dependencies between languages are taken into account, the conclusion that Chen originally drew doesn’t really hold up much:

When applying the strictest tests for relatedness, and when data is not aggregated across individuals, the correlation is not significant.”

Similarly, Amy Cuddy et al’s study on how power posing increases testosterone levels also got published only because the p value just scraped in below 0.05 at 0.045 or so. You can see in their figure 3 reporting the testosterone increase

that their confidence intervals are huge (this is probably why they report standard errors, it wouldn’t look so impressive if they had reported CIs). All they needed to show to make their point was to get the p-value below 0.05. The practical relevance of a 12 picogram/ml increase in testosterone is left unaddressed.  Another recent example from Psychological Science, which seems to publish studies that might attract attention in the popular press, is this study on how ovulating women wear red.  This study is a follow up on the notorious Psychological Science study by Beall and Tracy. In my opinion, the Beall and Tracy study reports a bogus result because they claim that women wear red or pink when ovulating, but when I reanalyzed their data I found that the effect was driven by pink alone. Here is my GLM fit for red or pink, red only and pink only. You can see that the “statistically significant” effect is driven entirely by pink, making the title of their paper (Women Are More Likely to Wear Red or Pink at Peak Fertility) true only if you allow the exclusive-or reading of the disjunction:

The new study by Eisenbruch et al reports a statistically significant effect on this red-pink issue, but now it’s only about red:

“A mixed regression model confirmed that, within subjects, the odds of wearing red were higher during the estimated fertile window than on other cycle days, b = 0.93, p = .040, odds ratio (OR) = 2.53, 95% confidence interval (CI) = [1.04, 6.14]. The 2.53 odds ratio indicates that the odds of wearing a red top were about 2.5 times higher inside the fertile window, but there was a wide confidence interval.”

To their credit, they note that their confidence interval is huge, and essentially includes 1. But since the p-value is below 0.05 this result is considered evidence for the “red hypothesis”. It may well be that women who are ovulating wear red; I have no idea and have no stake in the issue. Certainly, I am not about to start looking at women wearing red as potential sexual partners (quite independent from the fact that my wife would probably kill me if I did). But it would be nice if people would try to do high powered studies, and report a replication in the same study they publish. Luckily nobody will die if these studies report mistaken results, but the same mistakes are happening in medicine, where people will die as a result of incorrect conclusions being drawn.

All these examples show why the focus on p-values is so damaging for answering research questions.

Not surprisingly, for the statistician, the main point of fitting a model (even in a confirmatory factorial analysis) is not to derive a p-value from it; in fact, for many statisticians the p-value may not even rise to consciousness.  The main point of fitting a model is to define a process which describes, in the most economical way possible, how the data were generated. If the data don’t allow you to estimate some of the parameters, then, for a statistician it is completely reasonable to back off to defining a simpler generative process.

This is what Gelman and Hill also explain in their 2007 book (italics mine). Note that they are talking about fitting Bayesian linear mixed models (in which parameters like correlations can be backed off to 0 by using appropriate priors; see the Stan code using lkj priors here), not frequentist models like lmer. Also, Gelman would never, ever compute a p-value.

Gelman and Hill 2007, p. 549:

“Don’t get hung up on whether a coefficient “should” vary by group. Just allow it to vary in the model, and then, if the estimated scale of variation is small (as with the varying slopes for the radon model in Section 13.1), maybe you can ignore it if that would be more convenient
Practical concerns sometimes limit the feasible complexity of a model—for example, we might fit a varying-intercept model first, then allow slopes to vary, then add group-level predictors, and so forth. Generally, however, it is only the difficulties of fitting and, especially, understanding the models that keeps us from adding even more complexity, more varying coefficients, and more interactions.”

For the statistician, simplicity of expression and understandability of the model (in the Gelman and Hill sense of being able to derive sensible posterior (predictive) distributions) are of paramount importance. For the psychologist and linguist (and other areas), what matters is whether the result is statistically significant. The more vigorously you can reject the null, the more excited you get, and the language provided for this (“highly significant”) also gives the illusion that we have found out something important (=significant).

This seems to be a fundamental disconnect between statisticians, and end-users who just want their p-value. A further source of the disconnect is that linguists and psychologists etc. look for cookbook methods, what a statistician I know once derisively called a “one and done” approach. This leads to blind data fitting: load data, run single line of code, publish result. No question ever arises about whether the model even makes sense. In a way this is understandable; it would be great if there was a one-shot solution to fitting, e.g., linear mixed models. It would simplify life so much, and one wouldn’t need to spend years studying statistics before one can do science. However, the same scientists who balk at studying statistics will willingly spend time studying their field of expertise. No mainstream (by which I mean Chomskyan) syntactician is going to ever use commercial software to print out his syntactic derivation without knowing anything about the syntactic theory. Yet this is exactly what these same people expect from statistical software, to get an answer without having any understanding of the underlying statistical machinery.

 The bottom line that I tried to convey in my course was: forget about the p-value (except to soothe the reviewer and editor and to build your career), focus on doing high powered studies, check model assumptions, fit appropriate models, replicate your findings, and publish against your own pet theories. Understanding what all these words means requires some study, and we should not shy away from making that effort.

PS I am open to being corrected—like everyone else, I am prone to making mistakes. Please post corrections, but with evidence, in the comments section. I moderate the comments because some people post spam there, but I will allow all non-spam comments.

To leave a comment for the author, please follow the link and comment on his blog: Shravan Vasishth's Slog (Statistics blog).

R-bloggers.com offers daily e-mail updates about R news and tutorials on topics such as: visualization (ggplot2, Boxplots, maps, animation), programming (RStudio, Sweave, LaTeX, SQL, Eclipse, git, hadoop, Web Scraping) statistics (regression, PCA, time series, trading) and more...

Importing Data Into R – Part Two

$
0
0

(This article was first published on The DataCamp Blog » R, and kindly contributed to R-bloggers)

In this follow-up tutorial of This R Data Import Tutorial Is Everything You Need-Part One, DataCamp continues with its comprehensive, yet easy tutorial to quickly import data into R, going from simple, flat text files to the more advanced SPSS and SAS files.

As a lot of our readers noticed correctly from the first post, some great packages to import data into R haven’t yet received any attention, nor did the post cover explicitly the distinction between working with normal data sets and large data sets. That is why this will be the focus of today’s post.

Keep on reading to discover other and new ways to import your specific file into R, and feel free to reach out if you have additional questions or spot an error we should correct.

Matrix_Code

Getting Data From Common Sources into R

Firstly, this post will go deeper into the ways of getting data from common sources, which is often spreadsheet-like data, into R. Just like with the previous post, the focus will be on reading data into R that is different from Excel or any other type of files.

Next, the data from other sources like statistical software, databases, webscraping, etc. will be discussed.

If you want to know more about the possible steps that you might need to undertake before importing your data, go to our first post, which explains how you can prepare your data and workspace before getting your data into R.

Reading in Flat Files Into R with scan()

Besides read.table(), which was mentioned in the first post of the R data import tutorial, the scan() function can also work when handling data that is stored in simple delimited text files. Unlike the read.table() function, the scan() function returns a list or a vector, not a dataframe.

Suppose you have the following .txt document:

24 1991
21 1993
53 1962

You can read in the data (which you can download here) with the following command:

data <- scan("birth.txt")

Note that your file can also be an online data set. In that case, you just pass the URL as the first argument of the scan() function.

Alternatively, you could also read in the data into a matrix:

data <- matrix(scan("birth.txt"), 
               nrow=2, 
               byrow=TRUE)

Tip: if you want to do this thoroughly, you might need to specify additional arguments to make the matrix just the way you want it to be. Go to this page for more information on the matrix() function.

You can also read the columns of the input file into separate vectors:

data <- scan("age.txt", 
             what = list(Age = 0, 
                         Birthyear= 0),
             skip=1,
             quiet=TRUE)

Note how you first pass the (path to the) file with its extension as an argument (depending on whether you set the working directory to the folder that holds your dataset or not) and then specify the type of data to be read in, whether or not you want to skip the first line of your dataset, which character delimits the fields and if you want to print a line that says how many items have been read.

If your data can also contain other data types, you should tweak the scan() function a little bit, just like in this example:

data <- scan("age.csv", 
             what = list(Age = 0, 
                         Name= "", 
                         Birthyear= 0),
             skip=1,
             sep=";",
             quiet=TRUE)

Tip: you can do this yourself, too! Download the text file that was used above here.

And then you can also read in the data in a data frame:

data <- data.frame(scan("age.csv", 
                        what = list(Age = 0, 
                                    Name = "", 
                                    Birthyear= 0),
                        skip=1,
                        sep=";",
                        quiet=TRUE)

Tip: a lot of the arguments that the scan() function can take are the same as the ones that you can use with the read.table() function. That is why it’s always handy to check out the documentation! Go here if you want to read up on the scan() function’s arguments.

Remember that you can get the working directory and set it with the following commands, respectively:

getwd()
setwd("<path to your folder>")

Getting Fixed Column Data Into R with read.fwf()

To read a table of “fixed width formatted data” into a data frame in R, you can use the read.fwf() function from the utils package.

You use this function when your data file has columns containing spaces, or columns with no spaces to separate them.

   Phys / 00 / 1:    M  abadda
   Math / 00 / 2:    F  bcdccb
   Lang / 00 / 3:    F  abcdab
   Chem / 00 / 4:    M  cdabaa

Here, you do know that, for example, the subject values always reside in the first 7 characters of each line and the sex values are always at 22, and the scores start from character 25 to 30.

If you want to try out loading these data into R, you can easily download the text file here.

You would need to execute the following command to get the data from above correctly into R:

read.fwf("scores.txt", 
         widths= c(7,-14,1,-2,1,1,1,1,1,1), 
         col.names=c("subject","sex","s1","s2","s3","s4","s5","s6"),
         strip.white=TRUE)   

Note that the widths argument gives the widths of the fixed-width fields. In this case, the first seven characters in the file are reserved for the course names; Then, you don’t want the next fourteen characters to be read in: you pass -14. Next, you need one character to represent the sex, but you don’t want the two following characters, so you pass -2. All following characters need to be read in into separate columns, so you split them by passing 1,1,1,1,1,1 to the argument. Of course these values can and will differ, depending on what colums you want to import.

There are a number of extra arguments that you can pass to the read.fwf()function. Click here to read up on them.

Note that if you want to load in a file using Fortran-style format specifications, you can use the read.fortran() function:

data <- tempfile()
cat(file = data, "345678", "654321", sep = "n")
read.fortran(data, c("F2.1","F2.0","I2"))

As you can see from the small example above, you use Fortran-style format specifications as a second argument to the read.fortran() function. The arguments that you could possibly pass are in the style of: “rFl.d”, “rDl.d”, “rXl”, “rAl” or “rIl”, where “l” is the number of columns, “d” is the number of decimal places, and “r” is the number of repeats. In this case, you see 2.1, 2.0 and 2 listed by means of the c() function, which means that you have three columns with two rows. In the first column, you have values with one decimal place, in the second and the third also contain values with no decimal place.

For what concerns the type of values that the columns contain, you can have:

  • “F” and “D” for numeric formats;
  • “A” if you have character values;
  • “I” for integer values;
  • And “X” to indicate columns that can be skipped skipped.

In this case, the first and second columns will contain numeric formats, while the third column contains integer values.

Note that the repeat code “r” and decimal place code “d” are always optional. The length code “l” is required except for “X” formats when “r” is present.

Getting Your (Google) Spreadsheets Into R

Spreadsheets can be imported into R in various ways, as you might have already read in our tutorial on reading and importing Excel files into R or our first This R Data Import Tutorial Is Everything You Need post. This section will elaborate on that and go even further, also including Google spreadsheets and DIF files!

Scroll further to find out more on how to import your spreadsheets into R.

Importing Excel Spreadsheets Into R

Apart from the xlsx package, you also have a number of other options to read spreadsheets into R:

1. Reading Excel Spreadsheets into R From The Clipboard

If you have a spreadsheet open, you can actually copy the contents to your clipboard and import them quickly into R. To do this, you can either use the readClipboard() or read.table() functions:

readClipboard() #Only on Windows
read.table(file="clipboard")`

As you will see if you try this out, the first approach works well for vector data, but it gets pretty complicated if you have tabular data in your clipboard. If you want to know more about read.table(), you should definitely go to the first part of the R data import tutorial or our tutorial on reading and importing Excel files into R.

2. Reading Excel Spreadsheets into R Through The RODBC Package

The second way to get your Excel spreadsheets into R is through the RODBC package:

  • A first way to use this package is like this:
library(RODBC)
connection <- odbcConnect("<DSN>")

Note that the argument that you pass to odbcConnect() is actually a DSN. For a complete guide on how to set up your DSN, on how to set up a connection, etc., go to this page an extensive, yet easily accessible tutorial!

  • Once you have set up your connection, you could also use the sqlQuery() function to get data from .xls spreadsheets:
query <- "<SQL Query>"
data <- sqlQuery(connection, 
                 query)
str(data)

Big tip: go to this page an extensive, yet easily accessible tutorial!

At the end of an R session, don’t forget to close the connections:

odbcCloseAll()

Tip: If you want to know more about importing spreadsheets or Excel files into R, definitely go to our first tutorial on importing data into R or consider reading our tutorial on reading and importing Excel files into R, which deals with the readxl and XLConnect packages, among others.

Importing Google Spreadsheets Into R

The googlesheets package with its gs_read() function allows you to read in Google spreadsheets into R.

Start by executing the following line of code:

gs_ls()

Let the browser start up and complete the authentication process. Then, if you want to read in the data or edit it, you have to register it. You can do this by specifying your spreadsheet by title or by key:

data <- gs_title("<your spreadsheet>")
data <- gs_key()

Next, you can read in the data:

gs_read(data)

This is only a short overview of what you do with the googlesheets package. Definitely read up on all details here, and make sure to also check out this page.

Reading in Data Interchange Format (DIF) Files Into R

Use the read.DIF() function to get your DIF files into R:

data <- read.DIF("<your spreadsheet>",
                 header=FALSE,
                 as.is = !stringsAsFactors)

Note that you can specify whether your spreadsheet has a header or not and whether you want to import the data “as is”, that is, whether you want to convert character variables to convert to factors. In this case, you didn’t want to have this, so you gave in !stringsAsFactors.

For more information on this function or its arguments, go to this page.

Getting Excel Files Into R

Besides spreadsheets, you might also be interested in getting your actual Excel files into R. Look no further and keep on reading to find out how you can do this!

Note that this post only elaborates on what has been described in our tutorial on reading and importing Excel files into R and our first This R Data Import Tutorial Is Everything You Need post!

Importing Excel Files Into R With readxl

Even though this package is still under active development, it’s really worth to check it out, because it offers you a pretty easy way to read in Excel files:

library(readxl)
read_excel("<path to file")

Remember that you can just type the file’s name, together with its extension if your folder is in your working directory. Get and set your working directory through the following lines of code:

getwd()
setwd("<Path to your folder>")

Note that you can specify the sheet to read, the column names and types, the missing values and the number of rows to skip before reading any data with the sheet, col_names, col_types, na and skip arguments, respectively. Read up on them here.

Reading In Excel Files Into R With openxlsx

The openxlsx package also provides you with a simple way to read Excel .xlsx files into R:

library(openxlsx)
read.xlsx("<path to your file>")

If you want to know more details on this package or on the arguments that you can pass to the read.xlsx() function, definitely click here.

Tip: If you want to know more about importing Excel files into R, definitely go to our first tutorial on “importing data into R” or consider reading our extensive tutorial on reading and importing Excel files into R, which also deals with the XLConnect package, amongst others.

Getting OpenDocument Spreadsheets Into R

Use the read.ods() function from the readODS package to read in your OpenDocument spreadsheets into R and put them into data frames:

library(readODS)
read.ods("<path to your file>",
         sheet = 1,
         formulaAsFormula = FALSE)

Note that, apart from the file that you want to get into R, you can specify the sheet that you want and that you have the possibility to display formulas as formulas (for example, “SUM(B1:B3)” or the resulting values).

Importing JavaScript Object Notation (JSON) Files Into R

In our first post on importing data into R, the rjson package was mentioned to get JSON files into R.

Nevertheless, there are also other packages that you can use to import JSON files into R. Keep on reading to find out more!

Importing JSON Files Into R With The jsonlite Package

Recently ranked in the top 25 of most downloaded R packages with 66952 downloads, the jsonlite package is definitely one of the favorite packages of R users.

You import JSON files with the fromJSON() function:

library(jsonlite)
data <- fromJSON("<Path to your JSON file>")

For a well-explained quickstart with the jsonlite package, go here.

Importing JSON Files Into R With The RJSONIO package

The third, well-known package to get JSON files into R is RJSONIO. Just like the jsonlite and the jsonlite packages, you use the fromJSON() function:

library(RJSONIO)
data <- fromJSON("<Path to your JSON file")

The Best JSON Package?

There has been considerable discussion about this topic. If you want to know more, you should definitely check out the following pages and posts:

  • this page offers mainly illustrations through code examples which provide you with more insight into the behavior and performance of JSON packages in R.
  • Definitely read this blogpost, which tries to figure out which package handles JSON data best in R.

Getting Data From Statistical Software Packages into R

If your data is not really spreadsheet-like and isn’t an Excel or JSON file, it might just be one that is made with one of the many statistical software packages.

This section will provide you with more ways to read in your SPSS, Stata or SAS files, while also giving an overview of importing files that come from S-plus and Epi Info. Definitely make sure to go back to our first post or to the links that are provided below if you want to have more information!

Importing SPSS Files into R

Instead of using the foreign package, you can also resort to the haven package to get your SPSS files into R.

Remember to make sure to install and activate it in your workspace before starting!

The haven package offers the read_spss() function to read SPSS files into R:

library(haven)
data <- read_spss("<path to your SPSS file>")

Importing Stata Files into R

Similar to the foreign package, the haven package also provides a function to read in Stata files into R, namely read_dta():

data <- read_dta("<path to your STATA file>")

Remember to always install your packages if necessary and to activate them in your workspace. For example, you can install and activate the haven package in your workspace with the following commands:

install.packages("haven")
library(haven)

Importing SAS Files into R

Since the sas7bdat package was cited in last post, this follow-up tutorial will focus on other ways to read in SAS files:

1. How To Import SAS XPORT Files into R With The foreign package

The foreign package with the read.xport() function also allows you to get your SAS XPORT files into R:

library(foreign)
data <- read.xport("<path to your SAS file>")

2. How To Import SAS XPORT Files into R With The SASxport Package

The sasXPORT package also allows to read in SAS XPORT files with the read.xport() function:

library(SASxport)
data <- read.xport("<path to your SAS file>")

3. How To Import SAS Files into R With The haven Package

Just like the foreign and the sas7bdat packages, the haven package also allows you to read in b7dat files into R with the read_sas() function:

library(haven)
data <- read_sas("<path to your SAS file>")

Getting S-plus Files Into R

For old S-plus datasets, namely those that were produced on either Windows versions 3.x, 4.x or 2000 or Unix, version 3.x with 4 byte integers, you can use the read.S() function from the foreign package:

library(foreign)
data <- read.S("<Path to your file>")

Reading In Epi Info Files Into R

As you may have read in our previous tutorial or in this one, the foreign package offers many functions to read in specific files into R, and Epi Info is one of them. You can just use the read.epiinfo() function to get your data into R:

library(foreign)
data <- read.epiinfo("<Path to your file>")

For more information on Epi Info, click here.

Getting Data From Other Sources Into R

Next to the common sources and the statistical software, there are also many other sources from which you can have data that you want to read into R.

A few are listed below. Keep on reading!

Importing MATLAB Files Into R

You can use the R.matlab package with its readMat() function to import MATLAB files into R.

You can either pass a character string as a first argument to this function or you can pass a raw vector. In the first case, your input would be interpreted as a filename, while in the second case it will be considered a raw binary connection:

library(R.matlab)
data <- readMat("<Path to your file>")

The readMat() function will return a named list structure that contains all variables from the MAT file that you imported.

Reading In Octave Files Into R

The foreign package is here again! Use the read.octave() function to import Octave text data into R:

library(foreign)
data <- read.octave("<Path to your file>")

Getting FitbitScraper Data Into R

You can use the fitbitScraper package to get data from fitbit.

(For those who aren’t familiar with the company: the company offers products such as activity trackers and other technology devices that measure personal data such as the number of steps walked or the quality of sleep.)

Go here for a short and practical tutorial on how you can use the fitbitScraper package.

Importing Quantmod Data Into R

you can use this package to extracting financial data from an Internet source with R. The function that you use to get your data into R is getSymbols(), like in this example:

library(quantmod)
data <- getSymbols("YHOO", src="google")

Note that first you specify a character vector with the names of each symbol to be loaded. In this case, that is "YHOO". Then, you define a sourcing method. The sourcing methods that are available at this point in time are yahoo, google, MySQL, FRED, csv, RData, and oanda.

Next, you specify the lookup parameters and save them for future sessions:

setSymbolLookup(YHOO='google',GOOG='yahoo') 
saveSymbolLookup(file="mysymbols.rda") 

The new sessions then call

loadSymbolLookup(file="mysymbols.rda")
getSymbols(c("YHOO","GOOG")) 

If you want more information on quantitative finance applications in R, click here or go to this page for a detailed tutorial for beginners on working with quantmod.

Getting ARFF Files Into R

Data from Weka Attribute-Relation File Format (ARFF) files can be read in with the read.arff() function:

library(foreign)
data <- read.arff("<Path to your file>")

For more information on this function, go to this page.

Note that the RWeka package also offers the same function to import ARFF files. Go here if you want to know more!

Importing Data From Databases Into R

Besides MonetDB.R, rmongodb and RMySQL, which were covered in the previous post, you also have other packages to connect with your databases in R.

you also have mongolite, RMongo, RODBC, ROracle, RPostgreSQL, RSQLite, RJDBC.

For tutorials on these packages, check out the following list:

Note that there is also a database interface package DBI which allows communication between R and relational database management systems. For more information, click here.

Some explanations on how to work with this package can be found here.

Getting Binary Files Into R

Binary data files contain information that is stored in groups of binary digits. Each binary digit is a zero or one. Eight binary digits that are grouped together form a byte. You can read in binary data with the readBin() function:

connection <- file("<path to your file>", "rb") #You open the connection as "reading binary"(rb)
data <- readBin(connection,
                what="numeric") #Mode of the vector to be read

For a more detailed example, go to this page. For more information on the readBin() function, click here.

Reading In Binary Data Formats Into R

The packages hdf5, h5r, rhdf5, RNetCDF, ncdf and ncdf4 provide interfaces to NASA’s HDF5 and to UCAR’s netCDF data files.

For those of you who are interested in some tutorials on how to work with HDF5 or netCDF files in R, consider checking out the following resources:

  • You can find a nice tutorial on working with HDF files in R, also using the pathfinder package here;
  • An easily accessible tutorial for beginners on netCDF in R can be found on this page.

Getting Your DBF Files Into R

A DBF or DataBase File is the underlying format of dBase. You can read in DBF files with the use of the foreign package, which offers the read.dbf() function:

library(foreign)
data <- read.dbf("<Path to your file>")

Note that if you’re using Windows, you can also use the RODBC package with the odbcConnectDbase() function to read DBF files via Microsoft’s dBase ODBC driver.

Importing Flat Contingency Tables Into R

The foreign package allows you to read multiple file formats; ‘Flat’ contingency tables are no exception. You can use the read.ftable() function to accomplish this:

library(foreign)
data <- read.ftable("<Path to your file>")

Remember that “flat” contingency tables are very similar to the “normal” contingency tables: they contain
the counts of each combination of the levels of the variables (factors) involved. However, this information is re-arranged as a matrix whose rows and columns correspond to the unique combinations of the levels of the row and column variables. “Flat” contingency tables are therefore often preferred to represent higher-dimensional contingency tables.

Reading in Geographical Information System (GIS) Files Into R

You can use the rgdal and raster packages, amongst others, to get your GIS files into R.

If you’re not sure how to start using the rgdal package, consider checking out this nice blog post, which introduces you to working with geospatial data in R.
You can also check out this tutorial, which works with rgdal as well as with raster.

Importing Integrated Taxonomical Information (ITIS) Tables Into R

You can import ITIS tables with the read.table() function:

data <- read.table("<Path to your file>")

For more information on ITIS, click here.

Importing Large Data Sets Into R

Importing large data sets often causes discussion amongst R users. Besides the packages that are meant to connect with databases, there are also some others that stand out when working with big data.

Importing Large Data Sets Into R With the data.table Package

Described as the “fast and friendly file finagler”, the popular data.table package is an extremely useful and easy to use. Its fread() function is meant to import data from regular delimited files directly into R, without any detours or nonsense.

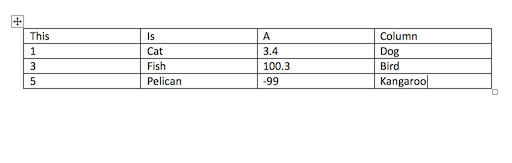
Note that “regular” in this case means that every row of your data needs to have the same number of columns. An example:

  V1 V2 V3
1  1  6  a
2  2  7  b
3  3  8  c
4  4  9  d
5  5 10  e

One of the great things about this function is that all controls, expressed in arguments such as sep, colClasses and nrows are automatically detected. Also, bit64::integer64 types are also detected and read directly without needing to read as character before converting.

Remember that bit64::integer64 types are 64 bit integers: these numbers are stored in the computer as being 64 bits long. By default, these are 32 bits only. Because the bit64::integer64 types are detected, the system knows it’s a number and it’s not being read in as a character to then be converted into an integer.

An example of the fread() function is:

library(data.table)
data <- fread("http://assets.datacamp.com/blog_assets/chol.txt")
data
##      AGE HEIGHT WEIGHT CHOL  SMOKE BLOOD  MORT
##   1:  20    176     77  195 nonsmo     b alive
##   2:  53    167     56  250 sigare     o  dead
##   3:  44    170     80  304 sigare     a  dead
##   4:  37    173     89  178 nonsmo     o alive
##   5:  26    170     71  206 sigare     o alive
##  ---                                          
## 196:  35    174     57  222   pipe     a alive
## 197:  38    172     91  227 nonsmo     b alive
## 198:  26    170     60  167 sigare     a alive
## 199:  39    165     74  259 sigare     o alive
## 200:  49    178     81  275   pipe     b alive

Note that reading in your data with the fread() function returns you a data table:

str(data)
## Classes 'data.table' and 'data.frame':   200 obs. of  7 variables:
##  $ AGE   : int  20 53 44 37 26 41 39 28 33 39 ...
##  $ HEIGHT: int  176 167 170 173 170 165 174 171 180 166 ...
##  $ WEIGHT: int  77 56 80 89 71 62 75 68 100 74 ...
##  $ CHOL  : int  195 250 304 178 206 284 232 152 209 150 ...
##  $ SMOKE : chr  "nonsmo" "sigare" "sigare" "nonsmo" ...
##  $ BLOOD : chr  "b" "o" "a" "o" ...
##  $ MORT  : chr  "alive" "dead" "dead" "alive" ...
##  - attr(*, ".internal.selfref")=<externalptr>

This is different from the read.table(), which creates a data frame of your data.

You can find more on the differences between data frames and data tables are explained here. In short, the most important thing is to know that all data.tables are also data.frames: data.tables are data.frames, too. A data.table can be passed to any package that only accepts data.frame and that package can use the [.data.frame syntax on the data.table. Read more on data.table here.

library(data.table)
data <- fread("http://assets.datacamp.com/blog_assets/chol.txt",
              sep=auto,
              nrows = -1,
              na.strings = c("NA","N/A",""),
              stringsAsFactors=FALSE
              )

Note that the input may also be a file that you want to read in and doesn’t always need to be a URL. Also, note how many of the arguments are the same as the ones that you use in read.table(), for example.

Tip: want to know more about data.table? Maybe our course on Data Analysis In R, The data.table Way can interest you! With the guidance of Matt Dowle and Arun Srinivasan you will go from being a data.table novice to data.table expert in no time.

Getting Large Data Sets Into R With The ff Package

The ff package allows for the “memory-efficient storage of large data on disk and fast access functions”. It’s one of the solutions that frequently pops up when you’re looking into discussions that deal with reading in big data as data frames, like here.

If you want to import separated flat files into ff data frames, you can just use the read.table.ffdf(), read.csv.ffdf(), read.csv2.ffdf(), read.delim.ffdf() or read.delim2.ffdf() functions, much like the read.table() function and its variants or convenience wrappers, which are described in one of our previous posts:

bigdata <- read.table.ffdf(file="<Path to file>",
                           nrows=n)

Note that your first argument can be NULL (like in this case) or can designate an optional ffdf object to which the read records are appended. If you want to know more, please go here. Then, you name the file from which the data are read with the argument file. You can also specify a maximum number of rows to be read in with nrows (which is the same as you would do with read.table()!).

You can also go further and specify the file encoding, the levels or the name of a function that is called for reading each chunk:

library(ff)
bigdata <- read.table.ffdf(file="<Path to file>",
                           nrows=n, 
                           fileEncoding="", 
                           levels=NULL,
                           FUN="read.table")

Tip more arguments that you can add to the read.table.ffdf(), read.csv.ffdf(), read.csv2.ffdf(), read.delim.ffdf() or read.delim2.ffdf() functions can be found here.

Importing Large Data Sets Into R With bigmemory

Another package that frequently pops up in the search results for any query related to large data sets in R is the bigmemory package. This package allows you to “manage massive matrices with shared memory and memory-mapped files”.

Note that you can not use this package on Windows: there are no Windows binaries available.

library(bigmemory)
bigdata <- read.big.matrix(filename="<File name>",
                           sep="/",
                           header=TRUE,
                           skip=2)

As usual, you first give the file name to the function, and then you can begin to specify other things, like the separator symbol, the header or the number of lines to skip before starting to read in your file with the arguments sep, header and skip respectively.

Note that these are only a few examples! You can pass a lot more arguments to the read.big.matrix() function! Consider reading the documentation if you want to know more.

Reading in Large Data Sets Into R With The sqldf Package

The sqldf package is also one of the packages that you might consider using when you’re working with large data sets. This package allows you to “perform SQL selects on R”, and especially its read.csv.sql() function is very handy if you want to read a file into R, filtering it with an SQL statement. Then, only a portion of the data is processed by R:

library(sqldf)
bigdata <- read.csv.sql(file="<Path to your file>",
                        sql="select * from file where ...",
                        colClasses=c("character", 
                                     rep("numeric",10)))

Note that the example above is very similar to other functions that allow you to import large data sets into R, with the sole exception that the second argument that you pass to read.csv.sql() function is an SQL statement. The tables to which you refer in your SQL query are part of the file that you mention in the file argument of read.csv.sql().

Tip: for more information on how to work with sqldf, you can go here for a video tutorial or here for a written overview of the basics.

Importing Large Data Sets Into R With The read.table() Function

You can use the “standard” read.table() function to import your data, but this will probably take more time than other packages that are especially designed to work better with bigger data sets. To see how the read.table() function works, go back to our first post.

To make this function go a little bit faster, you could tweak it yourself to get an optimized read.table() function. This tweaking actually only consists of adding arguments to the usual read.table() function, just like this:

df <- read.table("<Path to your file>", 
                 header = FALSE, 
                 sep="/", 
                 quote = "",
                 na.strings = "EMPTY", 
                 colClasses = c("character", "numeric", "factor"),
                 strip.white = TRUE,                 
                 comment.char="", 
                 stringsAsFactors = FALSE,
                 nrows = n
                 )

Note that

  • you first pass the (path to your) file, depending on whether you have set your working directory to the folder in which the file is located or not.
  • Then, you use the header argument to indicate whether the file contains the names of the variables as its first line. This is not the case in the example above.
  • The field separator character is set as / with the argument sep; This means that the values on each line of the file are separated by this character.
  • Next, you can also choose to disable or enable quoting. In this case, since quote="", you disable quoting.
  • You also define that the string “EMPTY” in your dataset is to be interpreted as an NA value.
  • Then, you also define the classes of your columns: in this case, you indicate that the first column is character column, the second a numeric one and the last a factor.
  • With strip.white you allow the stripping of leading and trailing white space from unquoted character fields; This is only applicable when you have used the sep argument!
  • When comment.char is set as "", you turn off the interpretation of comments.
  • You don’t want characters to be converted to factors! That is why you have also defined colClasses. You confirm this by setting stringsAsFactors to FALSE.
    Tip: this argument is, together with colClasses and comment.char, probably one of the more important ones if you want to import your data smoothly!
  • Lastly, you put a maximum number of rows to read in.

Tip: if you want to have more information on all arguments that you can pass to the read.table() function, you should definitely consider reading our post on reading Excel files into R.

Getting Large Data Sets Into R With The readr Package

One of the faster packages that you may use to import your big data set into R could be the readr package, which allows you to read tabular text data, just like read.table. Nevertheless, the readr package offers “a number of replacement functions that provide additional functionality and are much faster” (see here).

df <- read_table("<Path to your file>",
                 col_names=TRUE)

Note that the readr package also offers the functions read_csv(), read_csv2(), read_delim(), read_fwf(), read_tsv() and many other functions that go faster than their original ones! Details can be found here.

Tip: more information on this package can be found on this GitHub page.

Some Remarks On Handling Big Data In R

For further tips on handling big data in R, you should probably take a look at this StackOverflow discussion, which deals with packages but also with tips such as storing your data in binary formats and the usage of saveRDS/readRDS or the rhdf5 package for the HDF5 format.

Note that this last file format has been covered above and that many other packages exist besides the ones that have been covered above. For example, the packages that are used to connect with databases, such as RODBC and MonetDB.R, can also easily be used to handle larger data sets and the dplyr package also proves its value when you want to work directly with data stored in several types of database.

Tip: interested in manipulating data in R? Then our interactive course on dplyr might be something for you! With the guidance of Garrett Grolemund, you will get to learn how to perform sophisticated data manipulation tasks using dplyr.

Make sure to also check out this interesting post, which tests the load performance of some of the packages listed above!

Getting Your Data Into R With The rio Package

This “Swiss-army knife for data Input/Output” makes the input and output of data into R easier for you! You can in- or output data from almost any file format: when you install the rio package, you pull a lot of separate data-reading packages into one. If you then want to input or output data, you just need to remember two functions: import() and export(): rio will rely on the separate data-reading packages to infer the data structure from the file extension, to natively read web-based data sources and to set reasonable defaults for import and export.

In short, rio supports a broad set of commonly used file types for import and export.

Importing your files with rio happens in the following way:

library(rio)
data <- import("<Path to your file>")

If you want to see exactly which file formats are supported by rio, visit this page.

On An Endnote

If you’re interested in learning more about working with big data in R, make sure to check out the How To Work With Quandl in R and the “Big Data Analysis With Revolution R Enterprise” courses at DataCamp!

facebooktwittergoogle_pluslinkedin

The post Importing Data Into R – Part Two appeared first on The DataCamp Blog .

To leave a comment for the author, please follow the link and comment on his blog: The DataCamp Blog » R.

R-bloggers.com offers daily e-mail updates about R news and tutorials on topics such as: visualization (ggplot2, Boxplots, maps, animation), programming (RStudio, Sweave, LaTeX, SQL, Eclipse, git, hadoop, Web Scraping) statistics (regression, PCA, time series, trading) and more...

Comparing World Ocean Atlases 2013 and 2013v2

$
0
0

(This article was first published on Dan Kelley Blog/R, and kindly contributed to R-bloggers)

Introduction

The ocedata package [1] provides data that may be of use to oceanographers,
either working with their own R code or working with the oce package [2]. One
such dataset, called levitus, holds sea surface temperature and salinity
(SST and SSS), based on the 2013 version of the World Ocean Atlas. An updated
version of this atlas is suggested by the WOA authors to be an improvement [3],
and so it will be used for an updated version of levitus in the upcoming
version of ocedata.

This blog item deals with differences between the two datasets.

Analysis

First, the netcdf files for temperature and salinity were downloaded from
online sources [4,5]. Then the data were loaded as follows.

 1
 2
 3
 4
 5
 6
 7
 8
 9
10
library(ncdf4)
con <- nc_open("woa13_decav_t00_01v2.nc")
## make a vector for later convenience
longitude <- as.vector(ncvar_get(con, "lon"))
latitude <- as.vector(ncvar_get(con, "lat"))
SST <- ncvar_get(con, "t_an")[,,1]
nc_close(con)
con <- nc_open("woa13_decav_s00_01v2.nc")
SSS <- ncvar_get(con, "s_an")[,,1]
nc_close(con)

Next, load the levitus dataset from the existing ocedata package
and compute the differences

1
2
3
4
5
6
library(oce)
data("levitus", package="ocedata")
library(MASS) # for truehist
par(mfrow=c(2,1), mar=c(3, 3, 1, 1), mgp=c(2, 0.5, 0))
dSST <- SST - levitus$SST
dSSS <- SSS - levitus$SSS

The main differences are said to be in data-sparse regions, e.g. high latitudes,
so an interesting check is to plot spatial patterns.

 1
 2
 3
 4
 5
 6
 7
 8
 9
10
par(mfrow=c(2,1), mar=c(3, 3, 1, 1), mgp=c(2, 0.5, 0))
data(coastlineWorld)
imagep(longitude, latitude, dSST, zlim=c(-3,3))
polygon(coastlineWorld[["longitude"]], coastlineWorld[["latitude"]],
        col='lightgray') 
mtext("SST change", side=3, adj=1)
imagep(longitude, latitude, dSSS, zlim=c(-3,3))
polygon(coastlineWorld[["longitude"]], coastlineWorld[["latitude"]],
        col='lightgray') 
mtext("SSS change", side=3, adj=1)

center

The figures confirm that the differences are mainly in high latitudes, with
estimates in Hudson’s Bay being particularly altered. A closer examination of
the author’s general locale may interest him, if nobody else…

1
2
3
4
imagep(longitude, latitude, dSST, zlim=c(-3,3), xlim=c(-90,-30), ylim=c(30, 90), asp=1)
polygon(coastlineWorld[["longitude"]], coastlineWorld[["latitude"]],
        col='lightgray') 
mtext("SST change", side=3, adj=1)

center

1
2
3
4
imagep(longitude, latitude, dSSS, zlim=c(-3,3), xlim=c(-90,-30), ylim=c(30, 90), asp=1)
polygon(coastlineWorld[["longitude"]], coastlineWorld[["latitude"]],
        col='lightgray') 
mtext("SSS change", side=3, adj=1)

center

Conclusions

The patterns of variation are as expected: the updated WOA differs mainly in
high latitudes. The differences seem mainly to arise in regions that are
anomalous compared to other waters at similar latitudes. For example, the
estimates for SST and SSS in Hudson’s Bay are markedly different in the two
atlases. I am not too surprised by this, and I’m not too concerned either; I
doubt that many researchers (other than some modelers) would have paid much
attention to WOA estimates for Hudson’s Bay. However, the changes in the
northern Labrador Sea are quite concerning, given the importance of that region
to Atlantic watermass formation, and the likelihood that WOA is used to
initialize numerical models.

References and resources

  1. Ocedata website

  2. Oce website

  3. NOAA document on WOA changes

  4. woa2013v2 temperature netcdf file

  5. woa2013v2 salinity netcdf file

  6. Jekyll source code for this blog entry: 2015-08-22-woa-2013-2.Rmd

To leave a comment for the author, please follow the link and comment on his blog: Dan Kelley Blog/R.

R-bloggers.com offers daily e-mail updates about R news and tutorials on topics such as: visualization (ggplot2, Boxplots, maps, animation), programming (RStudio, Sweave, LaTeX, SQL, Eclipse, git, hadoop, Web Scraping) statistics (regression, PCA, time series, trading) and more...

Modern Honey Network Machinations with R, Python, phantomjs, HTML & JavaScript

$
0
0

(This article was first published on Data Driven Security, and kindly contributed to R-bloggers)

This was (initially) going to be a blog post announcing the new mhn R package (more on what that is in a bit) but somewhere along the way we ended up taking a left turn at Albuquerque (as we often do here at ddsec hq) and had an adventure in a twisty maze of Modern Honey Network passages that we thought we’d relate to everyone.

Episode 0 : The Quest!

We find our intrepid heroes data scientists finally getting around to playing with the Modern Honey Network (MHN) software that they promised Jason Trost they’d do ages ago. MHN makes it easy to [freely] centrally setup, control, monitor and collect data from one or more honeypots. Once you have this data you can generate threat indicator feeds from it and also do analysis on it (which is what we’re interested in eventually doing and what ThreatStream does do with their global network of MHN contributors).

Jason has a Vagrant quickstart version of MHN which lets you kick the tyres locally, safely and securely before venturing out into the enterprise (or internet). You stand up the server (mostly Python-y things), then tell it what type of honeypot you want to deploy. You get a handy cut-and-paste-able string which you paste-and-execute on a system that will become an actual honeypot (which can be a “real” box, a VM or even a RaspberryPi!). When the honeypot is finished installing the necessary components it registers with your MHN server and you’re ready to start catching cyber bad guys.


(cyber bad guy)

Episode 1 : Live! R! Package!

We decided to deploy a test MHN server and series of honeypots on Digital Ocean since they work OK on the smallest droplet size (not recommended for a production MHN setup).

While it’s great to peruse the incoming attacks:

we wanted programmatic access to the data, so we took a look at all the routes in their API and threw together an R package to let us work with it.

library(mhn)

attacks <- sessions(hours_ago=24)$data
tail(attacks)

##                           _id destination_ip destination_port honeypot
## 3325 55d93cb8b5b9843e9bb34c75 111.222.33.111               22      p0f
## 3326 55d93cb8b5b9843e9bb34c74 111.222.33.111               22      p0f
## 3327 55d93d30b5b9843e9bb34c77 111.222.33.111               22      p0f
## 3328 55d93da9b5b9843e9bb34c79           <NA>             6379  dionaea
## 3329 55d93f1db5b9843e9bb34c7b           <NA>             9200  dionaea
## 3330 55d94062b5b9843e9bb34c7d           <NA>               23  dionaea
##                                identifier protocol       source_ip source_port
## 3325 bf7a3c5e-48e7-11e5-9fcf-040166a73101     pcap    45.114.11.23       58621
## 3326 bf7a3c5e-48e7-11e5-9fcf-040166a73101     pcap    45.114.11.23       58621
## 3327 bf7a3c5e-48e7-11e5-9fcf-040166a73101     pcap    93.174.95.81       44784
## 3328 83e2f4e0-4876-11e5-9fcf-040166a73101     pcap 184.105.139.108       43000
## 3329 83e2f4e0-4876-11e5-9fcf-040166a73101     pcap  222.186.34.160        6000
## 3330 83e2f4e0-4876-11e5-9fcf-040166a73101     pcap   113.89.184.24       44028
##                       timestamp
## 3325 2015-08-23T03:23:34.671000
## 3326 2015-08-23T03:23:34.681000
## 3327 2015-08-23T03:25:33.975000
## 3328 2015-08-23T03:27:36.810000
## 3329 2015-08-23T03:33:48.665000
## 3330 2015-08-23T03:39:13.899000

NOTE: that’s not the real destination_ip so don’t go poking since it’s probably someone else’s real system (if it’s even up).

You can also get details about the attackers (this is just one example):

attacker_stats("45.114.11.23")$data

## $count
## [1] 1861
## 
## $first_seen
## [1] "2015-08-22T16:43:59.654000"
## 
## $honeypots
## [1] "p0f"
## 
## $last_seen
## [1] "2015-08-23T03:23:34.681000"
## 
## $num_sensors
## [1] 1
## 
## $ports
## [1] 22

The package makes it really easy (OK, we’re probably a bit biased) to grab giant chunks of time series and associated metadata for further analysis.

While cranking out the API package we noticed that there were no endpoints for the MHN HoneyMap. Yes, they do the “attacks on a map” thing but don’t think too badly of them since most of you seem to want them.

After poking around the MHN source a bit more (and navigating the view-source of the map page) we discovered that they use a Go-based websocket server to push the honeypot hits out to the map. (You can probably see where this is going, but it takes that turn first).

Episode 2 : Hacking the Anti-Hackers

The other thing we noticed is that—unlike the MHN-server proper—the websocket component does not require authentication. Now, to be fair, it’s also not really spitting out seekrit data, just (pretty useless) geocoded attack source/dest and type of honeypot involved.

Still, this got us wondering if we could find other MHN servers out there in the cold, dark internet. So, we fired up RStudio again and took a look using the shodan package:

library(shodan)

# the most obvious way to look for MHN servers is to 
# scour port 3000 looking for content that is HTML
# then look for "HoneyMap" in the <title>

# See how many (if any) there are
host_count('port:3000 title:HoneyMap')$total
## [1] 141

# Grab the first 100
hm_1 <- shodan_search('port:3000 title:HoneyMap')

# Grab the last 41
hm_2 <- shodan_search('port:3000 title:HoneyMap', page=2)

head(hm_1)

##                                           hostnames    title
## 1                                                   HoneyMap
## 2                                  hb.c2hosting.com HoneyMap
## 3                                                   HoneyMap
## 4                                          fxxx.you HoneyMap
## 5            ip-192-169-234-171.ip.secureserver.net HoneyMap
## 6 ec2-54-148-80-241.us-west-2.compute.amazonaws.com HoneyMap
##                    timestamp                isp transport
## 1 2015-08-22T17:14:25.173291               <NA>       tcp
## 2 2015-08-22T17:00:12.872171 Hosting Consulting       tcp
## 3 2015-08-22T16:49:40.392523      Digital Ocean       tcp
## 4 2015-08-22T15:27:29.661104      KW Datacenter       tcp
## 5 2015-08-22T14:01:21.014893   GoDaddy.com, LLC       tcp
## 6 2015-08-22T12:01:52.207879             Amazon       tcp
##                                                                                                                                                                                                       data
## 1 HTTP/1.1 200 OKrnAccept-Ranges: bytesrnContent-Length: 2278rnContent-Type: text/html; charset=utf-8rnLast-Modified: Sun, 02 Nov 2014 21:16:17 GMTrnDate: Sat, 22 Aug 2015 17:14:22 GMTrnrn
## 2 HTTP/1.1 200 OKrnAccept-Ranges: bytesrnContent-Length: 2278rnContent-Type: text/html; charset=utf-8rnLast-Modified: Wed, 12 Nov 2014 18:52:21 GMTrnDate: Sat, 22 Aug 2015 17:01:25 GMTrnrn
## 3 HTTP/1.1 200 OKrnAccept-Ranges: bytesrnContent-Length: 2278rnContent-Type: text/html; charset=utf-8rnLast-Modified: Mon, 04 Aug 2014 18:07:00 GMTrnDate: Sat, 22 Aug 2015 16:49:38 GMTrnrn
## 4 HTTP/1.1 200 OKrnAccept-Ranges: bytesrnContent-Length: 2278rnContent-Type: text/html; charset=utf-8rnDate: Sat, 22 Aug 2015 15:22:23 GMTrnLast-Modified: Sun, 27 Jul 2014 01:04:41 GMTrnrn
## 5 HTTP/1.1 200 OKrnAccept-Ranges: bytesrnContent-Length: 2278rnContent-Type: text/html; charset=utf-8rnLast-Modified: Wed, 29 Oct 2014 17:12:22 GMTrnDate: Sat, 22 Aug 2015 14:01:20 GMTrnrn
## 6 HTTP/1.1 200 OKrnAccept-Ranges: bytesrnContent-Length: 1572rnContent-Type: text/html; charset=utf-8rnDate: Sat, 22 Aug 2015 12:06:15 GMTrnLast-Modified: Mon, 08 Dec 2014 21:25:26 GMTrnrn
##   port location.city location.region_code location.area_code location.longitude
## 1 3000          <NA>                 <NA>                 NA                 NA
## 2 3000   Miami Beach                   FL                305           -80.1300
## 3 3000 San Francisco                   CA                415          -122.3826
## 4 3000     Kitchener                   ON                 NA           -80.4800
## 5 3000    Scottsdale                   AZ                480          -111.8906
## 6 3000      Boardman                   OR                541          -119.5290
##   location.country_code3 location.latitude location.postal_code location.dma_code
## 1                   <NA>                NA                 <NA>                NA
## 2                    USA           25.7906                33109               528
## 3                    USA           37.7312                94124               807
## 4                    CAN           43.4236                  N2E                NA
## 5                    USA           33.6119                85260               753
## 6                    USA           45.7788                97818               810
##   location.country_code location.country_name                           ipv6
## 1                  <NA>                  <NA> 2600:3c02::f03c:91ff:fe73:4d8b
## 2                    US         United States                           <NA>
## 3                    US         United States                           <NA>
## 4                    CA                Canada                           <NA>
## 5                    US         United States                           <NA>
## 6                    US         United States                           <NA>
##            domains                org   os module                         ip_str
## 1                                <NA> <NA>   http 2600:3c02::f03c:91ff:fe73:4d8b
## 2    c2hosting.com Hosting Consulting <NA>   http                  199.88.60.245
## 3                       Digital Ocean <NA>   http                104.131.142.171
## 4         fxxx.you      KW Datacenter <NA>   http                  162.244.29.65
## 5 secureserver.net   GoDaddy.com, LLC <NA>   http                192.169.234.171
## 6    amazonaws.com             Amazon <NA>   http                  54.148.80.241
##           ip     asn link uptime
## 1         NA    <NA> <NA>     NA
## 2 3344448757 AS40539 <NA>     NA
## 3 1753452203    <NA> <NA>     NA
## 4 2733907265    <NA> <NA>     NA
## 5 3232361131 AS26496 <NA>     NA
## 6  915689713    <NA> <NA>     NA

Yikes! 141 servers just on the default port (3000) alone! While these systems may be shown as existing in Shodan, we really needed to confirm that they were, indeed, live MHN HoneyMap [websocket] servers.

Episode 3 : Picture [Im]Perfect

Rather than just test for existence of the websocket/data feed we decided to take a screen shot of every server, which is pretty easy to do with a crude-but-effective mashup of R and phantomjs. For this, we made a script which is just a call—for each of the websocket URLs—to the “built-in” phantomjs rasterize.js script that we’ve slightly modified to wait 30 seconds from page open to snapshot creation. We did that in the hopes that we’d see live attacks in the captures.

cat(sprintf("phantomjs rasterize.js http://%s:%s %s.png 800px*600pxn",
            hm_1$matches$ip_str,
            hm_1$matches$port,
            hm_1$matches$ip_str), file="capture.sh")

That makes capture.sh look something like:

phantomjs rasterize.js http://199.88.60.245:3000 199.88.60.245.png 800px*600px
phantomjs rasterize.js http://104.131.142.171:3000 104.131.142.171.png 800px*600px
phantomjs rasterize.js http://162.244.29.65:3000 162.244.29.65.png 800px*600px
phantomjs rasterize.js http://192.169.234.171:3000 192.169.234.171.png 800px*600px
phantomjs rasterize.js http://54.148.80.241:3000 54.148.80.241.png 800px*600px
phantomjs rasterize.js http://95.97.211.86:3000 95.97.211.86.png 800px*600px

Yes, there are far more elegant ways to do this, but the number of URLs was small and we had no time constraints. We could have used a
pure phantomjs solution (list of URLs in phantomjs JavaScript) or used
GNU parallel to speed up the image captures as well.

Sifting through ~140 images manually to see if any had “hits” would not have been too bad, bit a glance at the directory listing showed that many had the exact same size, meaning those were probably showing a default/blank map. We uniq‘d them by MD5 hash and made an image gallery of them:

It was interesting to see Mexico CERT and OpenDNS in the mix.

Most of the 141 were active/live MHN HoneyMap sites. We can only imagine what a full Shodan search for HoneyMaps on other ports would come back with (mostly since we only have the basic API access and don’t want to burn the credits).

Episode 3 : With “Meh” Data Comes Great Irresponsibility

For those who may not have been with DDSec for it’s entirety, you may not be aware that we have our own attack map (github).

We thought it would be interesting to see if we could mashup MHN HoneyMap data with our creation. We first had to see what the websocket returned. Here’s a bit of Python to do that (the R websockets package was abandoned by it’s creator, but keep an eye out for another @hrbrmstr resurrection):

import websocket
import thread
import time

def on_message(ws, message):
    print message

def on_error(ws, error):
    print error

def on_close(ws):
    print "### closed ###"


websocket.enableTrace(True)
ws = websocket.WebSocketApp("ws://128.199.121.95:3000/data/websocket",
                            on_message = on_message,
                            on_error = on_error,
                            on_close = on_close)
ws.run_forever()

That particular server is very active, hence why we chose to use it.

The output should look something like:

$ python ws.py
--- request header ---
GET /data/websocket HTTP/1.1
Upgrade: websocket
Connection: Upgrade
Host: 128.199.121.95:3000
Origin: http://128.199.121.95:3000
Sec-WebSocket-Key: 07EFbUtTS4ubl2mmHS1ntQ==
Sec-WebSocket-Version: 13


-----------------------
--- response header ---
HTTP/1.1 101 Switching Protocols
Upgrade: websocket
Connection: Upgrade
Sec-WebSocket-Accept: nvTKSyCh+k1Rl5HzxkVNAZjZZUA=
-----------------------
{"city":"Clarks Summit","city2":"San Francisco","countrycode":"US","countrycode2":"US","latitude":41.44860076904297,"latitude2":37.774898529052734,"longitude":-75.72799682617188,"longitude2":-122.41940307617188,"type":"p0f.events"}
{"city":null,"city2":"Singapore","countrycode":"US","countrycode2":"SG","latitude":32.78310012817383,"latitude2":1.2930999994277954,"longitude":-96.80670166015625,"longitude2":103.85579681396484,"type":"p0f.events"}

Those are near-perfect JSON records for our map, so we figured out a way to tell iPew/PewPew (whatever folks are calling it these days) to take any accessible MHN HoneyMap as a live data source. For example, to plug this highly active HoneyMap into iPew all you need to do is this:

http://ocularwarfare.com/ipew/?mhnsource=http://128.199.121.95:3000/data/

Once we make the websockets component of the iPew map a bit more resilient we’ll post it to GitHub (you can just view the source to try it on your own now).

Fin

As we stated up front, the main goal of this post is to introduce the mhn package. But, our diversion has us curious. Are the open instances of HoneyMap deliberate or accidental? If any of them are “real” honeypot research or actual production environments, does such an open presence of the MHN controller reduce the utility of the honeypot nodes? Is Greenland paying ThreatStream to use that map projection instead of a better one?

If you use the new package, found this post helpful (or, at least, amusing) or know the answers to any of those questions, drop a note in the comments.

To leave a comment for the author, please follow the link and comment on his blog: Data Driven Security.

R-bloggers.com offers daily e-mail updates about R news and tutorials on topics such as: visualization (ggplot2, Boxplots, maps, animation), programming (RStudio, Sweave, LaTeX, SQL, Eclipse, git, hadoop, Web Scraping) statistics (regression, PCA, time series, trading) and more...

Using R To Get Data *Out Of* Word Docs

$
0
0

(This article was first published on rud.is » R, and kindly contributed to R-bloggers)

This was asked on twitter recently:

The answer is a very cautious “yes”. Much depends on how well-formed and un-formatted the table is.

Take this really simple docx file: data.docx.

It has a single table in it:

data_docx

Now, .docx files are just zipped directories, so rename that to data.zip, unzip it and navigate to data/word/document.xml and you’ll see something like this (though it’ll be more compressed):

<?xml version="1.0" encoding="UTF-8" standalone="yes"?>
<w:document xmlns:wpc="http://schemas.microsoft.com/office/word/2010/wordprocessingCanvas" xmlns:mo="http://schemas.microsoft.com/office/mac/office/2008/main" xmlns:mc="http://schemas.openxmlformats.org/markup-compatibility/2006" xmlns:mv="urn:schemas-microsoft-com:mac:vml" xmlns:o="urn:schemas-microsoft-com:office:office" xmlns:r="http://schemas.openxmlformats.org/officeDocument/2006/relationships" xmlns:m="http://schemas.openxmlformats.org/officeDocument/2006/math" xmlns:v="urn:schemas-microsoft-com:vml" xmlns:wp14="http://schemas.microsoft.com/office/word/2010/wordprocessingDrawing" xmlns:wp="http://schemas.openxmlformats.org/drawingml/2006/wordprocessingDrawing" xmlns:w10="urn:schemas-microsoft-com:office:word" xmlns:w="http://schemas.openxmlformats.org/wordprocessingml/2006/main" xmlns:w14="http://schemas.microsoft.com/office/word/2010/wordml" xmlns:w15="http://schemas.microsoft.com/office/word/2012/wordml" xmlns:wpg="http://schemas.microsoft.com/office/word/2010/wordprocessingGroup" xmlns:wpi="http://schemas.microsoft.com/office/word/2010/wordprocessingInk" xmlns:wne="http://schemas.microsoft.com/office/word/2006/wordml" xmlns:wps="http://schemas.microsoft.com/office/word/2010/wordprocessingShape" mc:Ignorable="w14 w15 wp14">
<w:body>
    <w:tbl>
        <w:tblPr>
            <w:tblStyle w:val="TableGrid"/>
            <w:tblW w:w="0" w:type="auto"/>
            <w:tblLook w:val="04A0" w:firstRow="1" w:lastRow="0" w:firstColumn="1" w:lastColumn="0" w:noHBand="0" w:noVBand="1"/>
        </w:tblPr>
        <w:tblGrid>
            <w:gridCol w:w="2337"/>
            <w:gridCol w:w="2337"/>
            <w:gridCol w:w="2338"/>
            <w:gridCol w:w="2338"/>
        </w:tblGrid>
        <w:tr w:rsidR="00244D8A" w14:paraId="6808A6FE" w14:textId="77777777" w:rsidTr="00244D8A">
            <w:tc>
                <w:tcPr>
                    <w:tcW w:w="2337" w:type="dxa"/>
                </w:tcPr>
                <w:p w14:paraId="7D006905" w14:textId="77777777" w:rsidR="00244D8A" w:rsidRDefault="00244D8A">
                    <w:r>
                        <w:t>This</w:t>
                    </w:r>
                </w:p>
            </w:tc>
            <w:tc>
                <w:tcPr>
                    <w:tcW w:w="2337" w:type="dxa"/>
                </w:tcPr>
                <w:p w14:paraId="13C9E52C" w14:textId="77777777" w:rsidR="00244D8A" w:rsidRDefault="00244D8A">
                    <w:r>
                        <w:t>Is</w:t>
                    </w:r>
                </w:p>
            </w:tc>
...

We can easily make out a table structure with rows and columns. In the simplest cases (which is all I’ll cover in this post) where the rows and columns are uniform it’s pretty easy to grab the data:

library(xml2)
 
# read in the XML file
doc <- read_xml("data/word/document.xml")
 
# there is an egregious use of namespaces in these files
ns <- xml_ns(doc)
 
# extract all the table cells (this is assuming one table in the document)
cells <- xml_find_all(doc, ".//w:tbl/w:tr/w:tc", ns=ns)
 
# convert the cells to a matrix then to a data.frame)
dat <- data.frame(matrix(xml_text(cells), ncol=4, byrow=TRUE), 
                  stringsAsFactors=FALSE)
 
# if there are column headers, make them the column name and remove that line
colnames(dat) <- dat[1,]
dat <- dat[-1,]
rownames(dat) <- NULL
 
dat
 
##   This      Is     A   Column
## 1    1     Cat   3.4      Dog
## 2    3    Fish 100.3     Bird
## 3    5 Pelican   -99 Kangaroo

You’ll need to clean up the column types, but you have at least freed the data from the evil file format it was in.

If there is more than one table you can use XML node targeting to process each one separately or into a list. I’ve wrapped that functionality into a rudimentary function that will:

  • auto-copy a Word doc to a temporary location
  • rename it to a zip
  • unzip it to a temporary location
  • read in the document.xml
  • auto-determine the number of tables in the document
  • auto-calculate # rows & # columns per table
  • convert each table
  • return all the tables into a list
  • clean up the temporarily created items
library(xml2)
 
get_tbls <- function(word_doc) {
 
  tmpd <- tempdir()
  tmpf <- tempfile(tmpdir=tmpd, fileext=".zip")
 
  file.copy(word_doc, tmpf)
  unzip(tmpf, exdir=sprintf("%s/docdata", tmpd))
 
  doc <- read_xml(sprintf("%s/docdata/word/document.xml", tmpd))
 
  unlink(tmpf)
  unlink(sprintf("%s/docdata", tmpd), recursive=TRUE)
 
  ns <- xml_ns(doc)
 
  tbls <- xml_find_all(doc, ".//w:tbl", ns=ns)
 
  lapply(tbls, function(tbl) {
 
    cells <- xml_find_all(tbl, "./w:tr/w:tc", ns=ns)
    rows <- xml_find_all(tbl, "./w:tr", ns=ns)
    dat <- data.frame(matrix(xml_text(cells), 
                             ncol=(length(cells)/length(rows)), 
                             byrow=TRUE), 
                      stringsAsFactors=FALSE)
    colnames(dat) <- dat[1,]
    dat <- dat[-1,]
    rownames(dat) <- NULL
    dat
 
  })
 
}

Using this multi-table Word doc – doc3:

data3

we can extract the three tables thusly:

get_tbls("~/Dropbox/data3.docx")
 
## [[1]]
##   This      Is     A   Column
## 1    1     Cat   3.4      Dog
## 2    3    Fish 100.3     Bird
## 3    5 Pelican   -99 Kangaroo
## 
## [[2]]
##   Foo Bar Baz
## 1  Aa  Bb  Cc
## 2  Dd  Ee  Ff
## 3  Gg  Hh  ii
## 
## [[3]]
##   Foo Bar
## 1  Aa  Bb
## 2  Dd  Ee
## 3  Gg  Hh
## 4  1    2
## 5  Zz  Jj
## 6  Tt  ii

This function tries to calculate the rows/columns per table but it does rely on a uniform table structure.

Have an alternate method or more feature-complete way of handling Word docs as tabular data sources? Then definitely drop a note in the comments.

To leave a comment for the author, please follow the link and comment on his blog: rud.is » R.

R-bloggers.com offers daily e-mail updates about R news and tutorials on topics such as: visualization (ggplot2, Boxplots, maps, animation), programming (RStudio, Sweave, LaTeX, SQL, Eclipse, git, hadoop, Web Scraping) statistics (regression, PCA, time series, trading) and more...

abcfr 0.9-3

$
0
0

(This article was first published on Xi'an's Og » R, and kindly contributed to R-bloggers)

garden tree, Jan. 12, 2012In conjunction with our reliable ABC model choice via random forest paper, about to be resubmitted to Bioinformatics, we have contributed an R package called abcrf that produces a most likely model and its posterior probability out of an ABC reference table. In conjunction with the realisation that we could devise an approximation to the (ABC) posterior probability using a secondary random forest. “We” meaning Jean-Michel Marin and Pierre Pudlo, as I only acted as a beta tester!

abcrfThe package abcrf consists of three functions:

  • abcrf, which constructs a random forest from a reference table and returns an object of class `abc-rf’;
  • plot.abcrf, which gives both variable importance plot of a model choice abc-rf object and the projection of the reference table on the LDA axes;
  • predict.abcrf, which predict the model for new data and evaluate the posterior probability of the MAP.

An illustration from the manual:

data(snp)
data(snp.obs)
mc.rf <- abcrf(snp[1:1e3, 1], snp[1:1e3, -1])
predict(mc.rf, snp[1:1e3, -1], snp.obs)

Filed under: R, Statistics, University life Tagged: ABC, ABC model choice, abcrf, bioinformatics, CRAN, R, random forests, reference table, SNPs

To leave a comment for the author, please follow the link and comment on his blog: Xi'an's Og » R.

R-bloggers.com offers daily e-mail updates about R news and tutorials on topics such as: visualization (ggplot2, Boxplots, maps, animation), programming (RStudio, Sweave, LaTeX, SQL, Eclipse, git, hadoop, Web Scraping) statistics (regression, PCA, time series, trading) and more...

Spatio-Temporal Kriging in R

$
0
0

(This article was first published on R tutorial for Spatial Statistics, and kindly contributed to R-bloggers)

Preface

I am writing this post more for reminding to myself some theoretical background and the steps needed to perform spatio-temporal kriging in gstat.
This month I had some free time to spend on small projects not specifically related to my primary occupation. I decided to spend some time trying to learn this technique since it may become useful in the future. However, I have never used it before so I had to first try to understand its basics both in terms of theoretical background and programming.
Since I have used several resources to get a handle on it, I decided to share my experience and thoughts on this blog post because they may become useful for other people trying the same method. However, this post cannot be considered a full review of spatio-temporal kriging and its theoretical basis. I just mentioned some important details to guide myself and the reader through the comprehension of the topic, but these are clearly not exhaustive. At the end of the post I included some references to additional material you may want to browse for more details.

Introduction

This is the first time I considered spatio-temporal interpolation. Even though many datasets are indexed in both space and time, in the majority of cases time is not really taken into account for the interpolation. As an example we can consider temperature observations measured hourly from various stations in a determined study area. There are several different things we can do with such a dataset. We could for instance create a series of maps with the average daily or monthly temperatures. Time is clearly considered in these studies, but not explicitly during the interpolation phase. If we want to compute daily averages we first perform the averaging and then kriging. However, the temporal interactions are not considered in the kriging model. An example of this type of analysis is provided by (Gräler, 2012) in the following image, which depicts monthly averages for some environmental parameter in Germany:

There are cases and datasets in which performing 2D kriging on “temporal slices” may be appropriate. However, there are other instances where this is not possible and therefore the only solution is take time into account during kriging. For doing so two possible solutions are suggested in literature: using time as a third dimension, or fit a covariance model with both spatial and temporal components (Gräler et al., 2013).

Time as the third dimension

The idea behind this technique is extremely easy to grasp. To better understand it we can simply take a look at the equation to calculate the sample semivariogram, from Sherman (2011):

Under Matheron’s Intrinsic Hypothesis (Oliver et al., 1989) we can assume that the variance between two points, si and sj, depends only on their separation, which we indicate with the vector h in Eq.1. If we imagine a 2D example (i.e. purely spatial), the vector h is simply the one that connects two points, i and j, with a line, and its value can be calculated with the Euclidean distance:

If we consider a third dimension, which can be depth, elevation or time; it is easy to imagine Eq.2 be adapted to accommodate an additional dimension. The only problem with this method is that in order for it to work properly the temporal dimension needs to have a range similar to the spatial dimension. For this reason time needs to be scaled to align it with the spatial dimension. In Gräler et al. (2013) they suggest several ways to optimize the scaling and achieve meaningful results. Please refer to this article for more information.

Spatio-Temporal Variogram

The second way of taking time into account is to adapt the covariance function to the time component. In this case for each point si there will be a time ti associated with it, and to calculate the variance between this point and another we would need to calculate their spatial separation h and their temporal separation u. Thus, the spatio-temporal variogram can be computed as follows, from Sherman (2011):

With this equation we can compute a variogram taking into account every pair of points separated by distance h and time u.

Spatio-Temporal Kriging in R

In R we can perform spatio-temporal kriging directly from gstat with a set of functions very similar to what we are used to in standard 2D kriging. The package spacetime provides ways of creating objects where the time component is taken into account, and gstat uses these formats for its space-time analysis. Here I will present an example of spatio-temporal kriging using sensors’ data.

Data

In 2011, as part of the OpenSense project, several wireless sensors to measure air pollution (O3, NO2, NO, SO2, VOC, and fine particles) were installed on top of trams in the city of Zurich. The project now is in its second phase and more information about it can be found here: http://www.opensense.ethz.ch/trac/wiki/WikiStart
In this page some examples data about Ozone and Ultrafine particles are also distributed in csv format. These data have the following characteristics: time is in UNIX format, while position is in degrees (WGS 84). I will use these data to test spatio-temporal kriging in R.

Packages

To complete this exercise we need to load several packages. First of all sp, for handling spatial objects, and gstat, which has all the function to actually perform spatio-temporal kriging. Then spacetime, which we need to create the spatio-temporal object. These are the three crucial packages. However, I also loaded some others that I used to complete smaller tasks. I loaded the raster package, because I use the functions coordinates and projection to create spatial data. There is no need of loading it, since the same functions are available under different names in sp. However, I prefer these two because they are easier to remember. The last packages are rgdal and rgeos, for performing various operations on geodata.
The script therefore starts like:

Data Preparation

There are a couple of issues to solve before we can dive into kriging. The first is that we need to do is translating the time from UNIX to POSIXlt or POSIXct, which are standard ways of representing time in R. This very first thing we have to do is of course setting the working directory and loading the csv file:

setwd("...")
data <- read.table("ozon_tram1_14102011_14012012.csv", sep=",", header=T)

Now we need to address the UNIX time. So what is UNIX time anyway?
It is a way of tracking time as the number of seconds between a particular time and the UNIX epoch, which is January the 1st 1970 GMT. Basically, I am writing the first draft of this post on August the 18th at 16:01:00 CET. If I count the number of seconds from the UNIX epoch to this exact moment (there is an app for that!!) I find the UNIX time, which is equal to: 1439910060
Now let’s take a look at one entry in the column “generation_time” of our dataset:

> paste(data$generation_time[1])
[1] "1318583686494"

As you may notice here the UNIX time is represented by 13 digits, while in the example above we just had 10. The UNIX time here represents also the milliseconds, which is something we cannot represent in R (as far as I know). So we cannot just convert each numerical value into POSIXlt, but we first need to extract only the first 10 digits, and then convert it. This can be done in one line of code but with multiple functions:

data$TIME <- as.POSIXlt(as.numeric(substr(paste(data$generation_time), 1, 10)), origin="1970-01-01")

We first need to transform the UNIX time from numerical to character format, using the function paste(data$generation_time). This creates the character string shown above, which we can then subset using the function substr. This function is used to subtract characters from a string and takes three arguments: a string, a starting character and a stopping character. In this case we want to basically delete the last 3 numbers from our string, so we set the start on the first number (start=1), and the stop at 10 (stop=10). Then we need to change the numerical string back to a numerical format, using the function as.numeric. Now we just need one last function to tell R that this particular number is a Date/Time object. We can do this using the function as.POSIXlt, which takes the actual number we just created plus an origin. Since we are using UNIX time, we need to set the starting point at “1970-01-01“. We can test this function of the first element of the vector data$generation_time to test its output:

> as.POSIXlt(as.numeric(substr(paste(data$generation_time[1]), start=1, stop=10)), origin="1970-01-01")
[1] "2011-10-14 11:14:46 CEST"

Now the data.frame data has a new column named TIME where the Date/Time information are stored. 
Another issue with this dataset is in the formats of latitude and longitude. In the csv files these are represented in the format below:

> data$longitude[1]
[1] 832.88198
76918 Levels: 829.4379 829.43822 829.44016 829.44019 829.4404 ... NULL
 
> data$latitude[1]
[1] 4724.22833
74463 Levels: 4721.02182 4721.02242 4721.02249 4721.02276 ... NULL

Basically geographical coordinates are represented in degrees and minutes, but without any space. For example, for this point the longitude is 8°32.88’, while the latitude is 47°24.22’. For obtaining coordinates with a more manageable format we would again need to use strings.

data$LAT <- as.numeric(substr(paste(data$latitude),1,2))+(as.numeric(substr(paste(data$latitude),3,10))/60)
 
data$LON <- as.numeric(substr(paste(data$longitude),1,1))+(as.numeric(substr(paste(data$longitude),2,10))/60)

We use again a combination of paste and substr to extract only the numbers we need. For converting this format into degrees, we need to sum the degrees with the minutes divided by 60. So in the first part of the equation we just need to extract the first two digits of the numerical string and transform them back to numerical format. In the second part we need to extract the remaining of the strings, transform them into numbers and then divided them by 60.This operation creates some NAs in the dataset, for which you will get a warning message. We do not have to worry about it as we can just exclude them with the following line:

Subset

The ozone dataset by OpenSense provides ozone readings every minute or so, from October the 14th 2011 at around 11 a.m., up until January the 14th 2012 at around 2 p.m.

> min(data$TIME)
[1] "2011-10-14 11:14:46 CEST"
 
> max(data$TIME)
[1] "2012-01-14 13:40:43 CET"

The size of this dataset is 200183 rows, which makes it kind of big for perform kriging without a very powerful machine. For this reason before we can proceed with this example we have to subset our data to make them more manageable. To do so we can use the standard subsetting method for data.frame objects using Date/Time:

> sub <- data[data$TIME>=as.POSIXct('2011-12-12 00:00 CET')&data$TIME<=as.POSIXct('2011-12-14 23:00 CET'),]
> nrow(sub)
[1] 6734

Here I created an object named sub, in which I used only the readings from midnight on December the 12th to 11 p.m. on the 14th. This creates a subset of 6734 observations, for which I was able to perform the whole experiment using around 11 Gb of RAM. 
After this step we need to transform the object sub into a spatial object, and then I changed its projection into UTM so that the variogram will be calculated on metres and not degrees. These are the steps required to achieve all this:

#Create a SpatialPointsDataFrame
coordinates(sub)=~LON+LAT
projection(sub)=CRS("+init=epsg:4326")
 
#Transform into Mercator Projection
ozone.UTM <- spTransform(sub,CRS("+init=epsg:3395"))

Now we have the object ozone.UTM, which is a SpatialPointsDataFrame with coordinates in metres.

Spacetime Package

Gstat is able to perform spatio-temporal kriging exploiting the functionalities of the package spacetime, which was developed by the same team as gstat. In spacetime we have two ways to represent spatio-temporal data: STFDF and STIDF formats. The first represents objects with a complete space time grid. In other words in this category are included objects such as the grid of weather stations presented in Fig.1. The spatio-temporal object is created using the n locations of the weather stations and the m time intervals of their observations. The spatio-temporal grid is of size 𝑛∙𝑚. 
STIDF objects are the one we are going to use for this example. These are unstructured spatio-temporal objects, where both space and time change dynamically. For example, in this case we have data collected on top of trams moving around the city of Zurich. This means that the location of the sensors is not consistent throughout the sampling window.
Creating STIDF objects is fairly simple, we just need to disassemble the data.frame we have into a spatial, temporal and data components, and then merge them together to create the STIDF object.
The first thing to do is create the SpatialPoints object, with the locations of the sensors at any given time:

ozoneSP <- SpatialPoints(ozone.UTM@coords,CRS("+init=epsg:3395")) 

This is simple to do with the function SpatialPoints in the package sp. This function takes two arguments, the first is a matrix or a data.frame with the coordinates of each point. In this case I used the coordinates of the SpatialPointsDataFrame we created before, which are provided in a matrix format. Then I set the projection in UTM.
At this point we need to perform a very important operation for kriging, which is check whether we have some duplicated points. It may happen sometime that there are points with identical coordinates. Kriging cannot handle this and returns an error, generally in the form of a “singular matrix”. Most of the time in which this happens the problem is related to duplicated locations. So we now have to check if we have duplicates here, using the function zerodist:

dupl <- zerodist(ozoneSP) 

It turns out that we have a couple of duplicates, which we need to remove. We can do that directly in the two lines of code we would need to create the data and temporal component for the STIDF object:

ozoneDF <- data.frame(PPB=ozone.UTM$ozone_ppb[-dupl[,2]]) 

In this line I created a data.frame with only one column, named PPB, with the ozone observations in part per billion. As you can see I removed the duplicated points by excluding the rows from the object ozone.UTM with the indexes included in one of the columns of the object dupl. We can use the same trick while creating the temporal part:

ozoneTM <- as.POSIXct(ozone.UTM$TIME[-dupl[,2]],tz="CET") 
Now all we need to do is combine the objects ozoneSP, ozoneDF and ozoneTM into a STIDF:

timeDF <- STIDF(ozoneSP,ozoneTM,data=ozoneDF) 

This is the file we are going to use to compute the variogram and perform the spatio-temporal interpolation. We can check the raw data contained in the STIDF object by using the spatio-temporal version of the function spplot, which is stplot:

stplot(timeDF) 

Variogram

The actual computation of the variogram at this point is pretty simple, we just need to use the appropriate function: variogramST. Its use is similar to the standard function for spatial kriging, even though there are some settings for the temporal component that need to be included.

var <- variogramST(PPB~1,data=timeDF,tunit="hours",assumeRegular=F,na.omit=T) 

As you can see here the first part of the call to the function variogramST is identical to a normal call to the function variogram; we first have the formula and then the data source. However, then we have to specify the time units (tunits) or the time lags (tlags). I found the documentation around this point a bit confusing to be honest. I tested various combinations of parameters and the line of code I presented is the only one that gives me what appear to be good results. I presume that what I am telling to the function is to aggregate the data to the hours, but I am not completely sure. I hope some of the readers can shed some light on this!!
I must warn you that this operation takes quite a long time, so please be aware of that. I personally ran it overnight.

Plotting the Variogram

Basically the spatio-temporal version of the variogram includes different temporal lags. Thus what we end up with is not a single variogram but a series, which we can plot using the following line:

plot(var,map=F) 

which return the following image:

Among all the possible types of visualizations for spatio-temporal variogram, this for me is the easiest to understand, probably because I am used to see variogram models. However, there are also other ways available to visualize it, such as the variogram map:

plot(var,map=T) 

And the 3D wireframe:

Variogram Modelling

As in a normal 2D kriging experiment, at this point we need to fit a model to our variogram. For doing so we will use the function vgmST and fit.StVariogram, which are the spatio-temporal matches for vgm and fit.variogram.
Below I present the code I used to fit all the models. For the automatic fitting I used most of the settings suggested in the following demo:

demo(stkrige) 

Regarding the variogram models, in gstat we have 5 options: separable, product sum, metric, sum metric, and simple sum metric. You can find more information to fit these model, including all the equations presented below, in (Gräler et al., 2015), which is available in pdf (I put the link in the “More Information” section).

Separable

This covariance model assumes separability between the spatial and the temporal component, meaning that the covariance function is given by:

According to (Sherman, 2011): “While this model is relatively parsimonious and is nicely interpretable, there are many physical phenomena which do not satisfy the separability”. Many environmental processes for example do not satisfy the assumption of separability. This means that this model needs to be used carefully.
The first thing to set are the upper and lower limits for all the variogram parameters, which are used during the automatic fitting:

# lower and upper bounds
pars.l <- c(sill.s = 0, range.s = 10, nugget.s = 0,sill.t = 0, range.t = 1, nugget.t = 0,sill.st = 0, range.st = 10, nugget.st = 0, anis = 0)
pars.u <- c(sill.s = 200, range.s = 1000, nugget.s = 100,sill.t = 200, range.t = 60, nugget.t = 100,sill.st = 200, range.st = 1000, nugget.st = 100,anis = 700)

To create a separable variogram model we need to provide a model for the spatial component, one for the temporal component, plus the overall sill:

separable <- vgmST("separable", space = vgm(-60,"Sph", 500, 1),time = vgm(35,"Sph", 500, 1), sill=0.56) 

This line creates a basic variogram model, and we can check how it fits our data using the following line:

plot(var,separable,map=F) 

One thing you may notice is that the variogram parameters do not seem to have anything in common with the image shown above. I mean, in order to create this variogram model I had to set the sill of the spatial component at -60, which is total nonsense. However, I decided to try to fit this model by-eye as best as I could just to show you how to perform this type of fitting and calculate its error; but in this case it cannot be taken seriously. I found that for the automatic fit the parameters selected for vgmST do not make much of a difference, so probably you do not have to worry too much about the parameters you select in vgmST.
We can check how this model fits our data by using the function fit.StVariogram with the option fit.method=0, which keeps this model but calculates its Mean Absolute Error (MSE), compared to the actual data:

> separable_Vgm <- fit.StVariogram(var, separable, fit.method=0)
> attr(separable_Vgm,"MSE")
[1] 54.96278

This is basically the error of the eye fit. However, we can also use the same function to automatically fit the separable model to our data (here I used the settings suggested in the demo):

> separable_Vgm <- fit.StVariogram(var, separable, fit.method=11,method="L-BFGS-B", stAni=5, lower=pars.l,upper=pars.u)
> attr(separable_Vgm, "MSE")
[1] 451.0745

As you can see the error increases. This probably demonstrates that this model is not suitable for our data, even though with some magic we can create a pattern that is similar to what we see in the observations. In fact, if we check the fit by plotting the model it is clear that this variogram cannot properly describe our data:

plot(var,separable_Vgm,map=F) 

To check the parameters of the model we can use the function extractPar:

> extractPar(separable_Vgm)
range.s nugget.s range.t nugget.t sill
199.999323 10.000000 99.999714 1.119817 17.236256

Product Sum

A more flexible variogram model for spatio-temporal data is the product sum, which do not assume separability. The equation of the covariance model is given by:

with k > 0.
In this case in the function vgmST we need to provide both the spatial and temporal component, plus the value of the parameter k (which needs to be positive):

prodSumModel <- vgmST("productSum",space = vgm(1, "Exp", 150, 0.5),time = vgm(1, "Exp", 5, 0.5),k = 50) 

I first tried to set k = 5, but R returned an error message saying that it needed to be positive, which I did not understand. However, with 50 it worked and as I mentioned the automatic fit does not care much about these initial values, probably the most important things are the upper and lower bounds we set before.
We can then proceed with the fitting process and we can check the MSE with the following two lines:

> prodSumModel_Vgm <- fit.StVariogram(var, prodSumModel,method = "L-BFGS-B",lower=pars.l)
> attr(prodSumModel_Vgm, "MSE")
[1] 215.6392

This process returns the following model:

Metric

This model assumes identical covariance functions for both the spatial and the temporal components, but includes a spatio-temporal anisotropy (k) that allows some flexibility.

In this model all the distances (spatial, temporal and spatio-temporal) are treated equally, meaning that we only need to fit a joint variogram to all three. The only parameter we have to modify is the anisotropy k. In R k is named stAni and creating a metric model in vgmST can be done as follows:

metric <- vgmST("metric", joint = vgm(50,"Mat", 500, 0), stAni=200) 

The automatic fit produces the following MSE:

> metric_Vgm <- fit.StVariogram(var, metric, method="L-BFGS-B",lower=pars.l)
> attr(metric_Vgm, "MSE")
[1] 79.30172

We can plot this model to visually check its accuracy:

Sum Metric

A more complex version of this model is the sum metric, which includes a spatial and temporal covariance models, plus the joint component with the anisotropy:

This model allows maximum flexibility, since all the components can be set independently. In R this is achieved with the following line:

sumMetric <- vgmST("sumMetric", space = vgm(psill=5,"Sph", range=500, nugget=0),time = vgm(psill=500,"Sph", range=500, nugget=0), joint = vgm(psill=1,"Sph", range=500, nugget=10), stAni=500) 

The automatic fit can be done like so:

> sumMetric_Vgm <- fit.StVariogram(var, sumMetric, method="L-BFGS-B",lower=pars.l,upper=pars.u,tunit="hours")
> attr(sumMetric_Vgm, "MSE")
[1] 58.98891

Which creates the following model:

Simple Sum Metric

As the title suggests, this is a simpler version of the sum metric model. In this case instead of having total flexibility for each component we restrict them to having a single nugget. Basically we still have to set all the parameters, even though we do not care about setting the nugget in each component since we need to set a nugget effect for all three:

SimplesumMetric <- vgmST("simpleSumMetric",space = vgm(5,"Sph", 500, 0),time = vgm(500,"Sph", 500, 0), joint = vgm(1,"Sph", 500, 0), nugget=1, stAni=500) 

This returns a model similar to the sum metric:

> SimplesumMetric_Vgm <- fit.StVariogram(var, SimplesumMetric,method = "L-BFGS-B",lower=pars.l)
> attr(SimplesumMetric_Vgm, "MSE")
[1] 59.36172

Choosing the Best Model

We can visually compare all the models we fitted using wireframes in the following way:

plot(var,list(separable_Vgm, prodSumModel_Vgm, metric_Vgm, sumMetric_Vgm, SimplesumMetric_Vgm),all=T,wireframe=T) 

The most important parameter to take into account for selecting the best model is certainly the MSE. By looking at the these it is clear that the best model is the sum metric, with an error of around 59, so I will use this for kriging.

Prediction Grid

Since we are performing spatio-temporal interpolation, it is clear that we are interested in estimating new values in both space and time. For this reason we need to create a spatio-temporal prediction grid. In this case I first downloaded the road network for the area around Zurich, then I cropped it to match the extension of my study area, and then I created the spatial grid:

roads <- shapefile("VEC25_str_l_Clip/VEC25_str_l.shp") 

This is the shapefile with the road network extracted from the Vector25 map of Switzerland. Unfortunately for copyright reasons I cannot share it. This file is projected in CH93, which is the Swiss national projection. Since I wanted to perform a basic experiment, I decided not to include the whole network, but only the major roads that in Switzerland are called Klass1. So the first thing I did was extracting from the roads object only the lines belonging to Klass1 streets:

Klass1 <- roads[roads$objectval=="1_Klass",] 

Then I changed the projection of this object from CH93 to UTM, so that it is comparable with what I used so far:

Klass1.UTM <- spTransform(Klass1,CRS("+init=epsg:3395")) 

Now I can crop this file so that I obtain only the roads within my study area. I can use the function crop in rgeos, with the object ozone.UTM that I created before:

Klass1.cropped <- crop(Klass1.UTM,ozone.UTM) 

This gives me the road network around the locations where the data were collected. I can show you the results with the following two lines:

plot(Klass1.cropped)
plot(ozone.UTM,add=T,col="red")

Where the Klass1 roads are in black and the data points are represented in red. With this selection I can now use the function spsample to create a random grid of points along the road lines:

sp.grid.UTM <- spsample(Klass1.cropped,n=1500,type="random") 

This generates the following grid, which I think I can share with you in RData format (gridST.RData):

As I mentioned, now we need to add a temporal component to this grid. We can do that again using the package spacetime. We first need to create a vector of Date/Times using the function seq:

tm.grid <- seq(as.POSIXct('2011-12-12 06:00 CET'),as.POSIXct('2011-12-14 09:00 CET'),length.out=5) 

This creates a vector with 5 elements (length.out=5), with POSIXct values between the two Date/Times provided. In this case we are interested in creating a spatio-temporal data frame, since we do not yet have any data for it. Therefore we can use the function STF to merge spatial and temporal data into a spatio-temporal grid:

grid.ST <- STF(sp.grid.UTM,tm.grid) 

This can be used as new data in the kriging function.

Kriging

This is probably the easiest step in the whole process. We have now created the spatio-temporal data frame, compute the best variogram model and create the spatio-temporal prediction grid. All we need to do now is a simple call to the function krigeST to perform the interpolation:

pred <- krigeST(PPB~1, data=timeDF, modelList=sumMetric_Vgm, newdata=grid.ST) 

We can plot the results again using the function stplot:

stplot(pred) 

More information

There are various tutorial available that offer examples and guidance in performing spatio-temporal kriging. For example we can just write:

vignette("st", package = "gstat") 

and a pdf will open with some of the instructions I showed here. Plus there is a demo available at:

demo(stkrige) 

In the article “Spatio-Temporal Interpolation using gstat” Gräler et al. explain in details the theory behind spatio-temporal kriging. The pdf of this article can be found here: https://cran.r-project.org/web/packages/gstat/vignettes/spatio-temporal-kriging.pdfThere are also some books and articles that I found useful to better understand the topic, for which I will put the references at the end of the post.

References

Gräler, B., 2012. Different concepts of spatio-temporal kriging [WWW Document]. URL geostat-course.org/system/files/part01.pdf (accessed 8.18.15).

Gräler, B., Pebesma, Edzer, Heuvelink, G., 2015. Spatio-Temporal Interpolation using gstat.

Gräler, B., Rehr, M., Gerharz, L., Pebesma, E., 2013. Spatio-temporal analysis and interpolation of PM10 measurements in Europe for 2009.

Oliver, M., Webster, R., Gerrard, J., 1989. Geostatistics in Physical Geography. Part I: Theory. Trans. Inst. Br. Geogr., New Series 14, 259–269. doi:10.2307/622687

Sherman, M., 2011. Spatial statistics and spatio-temporal data: covariance functions and directional properties. John Wiley & Sons.

All the code snippets were created by Pretty R at inside-R.org

To leave a comment for the author, please follow the link and comment on his blog: R tutorial for Spatial Statistics.

R-bloggers.com offers daily e-mail updates about R news and tutorials on topics such as: visualization (ggplot2, Boxplots, maps, animation), programming (RStudio, Sweave, LaTeX, SQL, Eclipse, git, hadoop, Web Scraping) statistics (regression, PCA, time series, trading) and more...

Bio7 2.3 Released!

$
0
0

(This article was first published on » R, and kindly contributed to R-bloggers)

28.08.2015

As a result of the useR conference 2015 with fantastic workshops and presentations where I also presented my software I released a new version of Bio7 with many improvements and new features inspired by the R conference and important for the next ImageJ conference 2015 where I will give a Bio7 workshop.

For this release I didn’t bundle R for MacOSX (so R is easier to update, etc.).
So for MacOSX and Linux R and Rserve have to be installed. But this becomes very easy because Bio7 uses now the default OS systems paths which normally point to the default R installation (as long as no path in the Bio7 preferences is specified).
In addition some precompiled Rserve binaries (cooperative mode) are available and can be installed easily from within R – see the installation section below.

Download Bio7: http://bio7.org

Release notes:

R

  • Updated R to 3.2.2 (Windows).
  • Added new R Markdown functionality – see video below (installation of ‘rmarkdown’, ‘knitr’ package and ‘pandoc’ binary required).

  • Added an option to use the JavaFX browser to open HTML markdown knitr documents to allow a fullscreen view (primary F1,F2, secondary F3, tertiary F4, quartary F5 monitor).
  • Added a simple default markdown editor to Bio7.
  • Added a new wizard for markdown documents.
  • In the ‘Navigator’ view you can now set the working dir of R (context menu action).
  • Added a new convert to list action in the context menu of the R-Shell.
  • Added a new default hidden „Custom“ perspective“ in which custom views can be opened in a predefined layout.
  • Added two new actions to open Bio7 views more easily (as a replacement for the disfunctional open view actions).
  • Improved the ImageJ ‘Zoom In’ and ‘Zoom Out’ action (now zooms correctly to the mouse pointer).
  • Improved the default paths for Linux and MacOSX.
  • Now the R system path, the R default library path and the pdflatex path is fetched from the PATH environment (as long as no specific location is set in the Bio7 preferences ).
  • Improved the installation of Rserve on Linux and Mac with precompiled Rserve libraries which can be installed easily from within R (R version 3.2.2 required!) .
  • Compiled Rserve in cooperative mode for MacOSX and Linux. This will make the installation process of Rserve very easy.
  • Deactivated some R editor options by default (can be enabled in the R preferences).

HTML GUI editor

  • Mouse selection now works again (thanks to Java 1.8.60).

ImageJ and R

  • Changed the variables names for the size of the image in the Particles transfer to ‘imageSizeX’, ‘imageSizeY’ (to be in accordance with the image matrix transfer).
  • Improved the ‘ImageMethods’ view ‘Selection’ action (see video below). Now it is opened as a view for multiple transfers.
  • Added new actions to transfer ImageJ selections as SpatialPolygons, SpatialLines or Spatial Points (or SpatialPolygonsDataframe, etc., if an available dataframe is selected). Selected objects can be transferred georeferenced if a georeferenced raster file (*.geotiff) is selected – see video below:

Linux

  • More stability improvements.
  • Fixed some Eclipse 4.5 bugs, feature? which opened an extra shell when opening an SWT ‘InputDialog’ class.
  • Improved the visual appearance of menus (menu size can be set in the Bio7 ImageJ preferences).
  • Improved the path to the native OS applications by using the systems path by default. So normally no paths have to be adjusted.

MacOSX

  • Improved the stability by fixing a bug/feature? in the Nebula grid spreadsheet components.
  • Now R has to be installed seperately. The default path will be fetched from the OS environment PATH (as long as no path is given in the preferences).
  • Rserve has to be installed from within R. A compiled binary is available and can be installed easily (see installation details below).
  • Fixed some Font bugs (especially for the console). Fonts can be customized in the default Bio7 CSS!

Java

  • Updated  Java to Jre 1.8.60.

ImageJ

  • Updated to version 1.50.a

Bug Fixes:

Many other improvements and bug fixes for Linux and MacOSX and Bio7 in general (see the Bio7 Bitbucket repository for details).

Installation:

Simply unzip the archive of Bio7 2.2 (Windows, Linux) in your preferred OS location. The MacOSX version can be installed easily with the available *.dmg file installer. To start the application simply double click on the  Bio7 binary file.

R and Rserve installation

For Linux and MacOSX R and Rserve has to be installed. Bio7 will fetch the default paths from the OS System PATH (so hopefully no other adjustments have to be made).

Rserve has to be available in cooperative mode which can be installed from the Bio7 Bitbucket website from within R with:

MacOSX:

install.packages(“https://bitbucket.org/maustenfeld/bio7-new/downloads/Rserve_1.8-4_Mac_cooperative.tgz”, repos=NULL)

Linux (compiled with Linux Mint 17.2):

install.packages(“https://bitbucket.org/maustenfeld/bio7-new/downloads/Rserve_1.8-4_Linux_cooperative.tgz”, repos=NULL)

Or simply download from the Bio7 Bitbucket repository:

https://bitbucket.org/maustenfeld/bio7-new/downloads

Compilation of Rserve (if necessary):

Rserve can be compiled and installed in the local R application with the shell command:

sudo PKG_CPPFLAGS=-DCOOPERATIVE R CMD INSTALL Rserve_1.8-4.tar.gz


R Markdown:

To use the R Markdown features please install the rmarkdown package, knitr from within R and the pandoc binaries from here:

https://github.com/jgm/pandoc/releases/latest

For Windows and MacOSX pandoc must be on the system PATH – Linux adds the path by default.

You can also add the path in R with:

MacOSX: Add pandoc to the OS PATH. Else type in the R console:

> Sys.setenv(PATH=”/usr/bin:/bin:/usr/sbin:/sbin:/usr/local/bin:$HOME/bin”)

or with the LaTeX path added:

>Sys.setenv(PATH=”/usr/bin:/bin:/usr/sbin:/sbin:/usr/local/bin:/Library/TeX/texbin:$HOME/bin”)

Linux: After installation available. Else type in the R console:

> Sys.setenv(PATH=”/usr/bin:/bin:/usr/sbin:/sbin:/usr/local/bin:$HOME/bin”)

Windows: Add pandoc path to the Windows PATH (evtl restart). Else type in the R console:

Sys.setenv(PATH=paste(Sys.getenv(“PATH”),”C:/pandoc”, sep=””))

The commands can be copied and saved for each startup (only if necessary) in the R preferences textfield: R->Preferences->Rserve Preferences->R startup commands

LaTeX:

To use LaTeX with Bio7 please install a LaTeX environment e.g.

Windows: MiKeTX (http://miktex.org/)

MacOSX: MacTeX (https://tug.org/mactex/)

Linux: TeX Live (http://www.tug.org/texlive/)

Then adjust the Bio7 path to the pdflatex binary (only necessary if not on the OS path!):

R->Preferences->Rserve preferences->pdflatex path

To get the installation location folder on Linux or on MacOSX type:

> which pdflatex

For Windows MikeTeX pdflatex can be typically found at:

C:Program Files (x86)MiKTeX 2.9miktexbin


Screenshots:

Linux

linuxbio723

MacOSX

macosxbio723

Windows

windowsbio723

To leave a comment for the author, please follow the link and comment on his blog: » R.

R-bloggers.com offers daily e-mail updates about R news and tutorials on topics such as: visualization (ggplot2, Boxplots, maps, animation), programming (RStudio, Sweave, LaTeX, SQL, Eclipse, git, hadoop, Web Scraping) statistics (regression, PCA, time series, trading) and more...

Two little annoying stats detail

$
0
0

(This article was first published on biologyforfun » R, and kindly contributed to R-bloggers)

A very brief post at the end of the field season on two little “details” that are annoying me in paper/analysis that I see being done (sometimes) around me.

The first one concern mixed effect models where the models built in the contain a grouping factor (say month or season) that is fitted as both a fixed effect term and as a random effect term (on the right side of the | in lme4 model synthax). I don’t really understand why anyone would want to do this and instead of spending time writing equations let’s just make a simple simulation example and see what are the consequences of doing this:


library(lme4)
set.seed(20150830)
#an example of a situation measuring plant biomass on four different month along a gradient of temperature
data<-data.frame(temp=runif(100,-2,2),month=gl(n=4,k=25))
modmat<-model.matrix(~temp+month,data)
#the coefficient
eff<-c(1,2,0.5,1.2,-0.9)
data$biom<-rnorm(100,modmat%*%eff,1)
#the simulated coefficient for Months are 0.5, 1.2 -0.9
#a simple lm
m_fixed<-lm(biom~temp+month,data)
coef(m_fixed) #not too bad
## (Intercept)        temp      month2      month3      month4 
##   0.9567796   2.0654349   0.4307483   1.2649599  -0.8925088

#a lmm with month ONLY as random term
m_rand<-lmer(biom~temp+(1|month),data)
fixef(m_rand)

## (Intercept)        temp 
##    1.157095    2.063714

ranef(m_rand)

## $month
##   (Intercept)
## 1  -0.1916665
## 2   0.2197100
## 3   1.0131908
## 4  -1.0412343

VarCorr(m_rand) #the estimated sd for the month coeff

##  Groups   Name        Std.Dev.
##  month    (Intercept) 0.87720 
##  Residual             0.98016

sd(c(0,0.5,1.2,-0.9)) #the simulated one, not too bad!

## [1] 0.8831761

#now a lmm with month as both fixed and random term
m_fixedrand<-lmer(biom~temp+month+(1|month),data) fixef(m_fixedrand) ## (Intercept) temp month2 month3 month4 ## 0.9567796 2.0654349 0.4307483 1.2649599 -0.8925088 ranef(m_fixedrand) #very, VERY small ## $month ## (Intercept) ## 1 0.000000e+00 ## 2 1.118685e-15 ## 3 -9.588729e-16 ## 4 5.193895e-16 VarCorr(m_fixedrand) ## Groups Name Std.Dev. ## month (Intercept) 0.40397 ## Residual 0.98018 #how does it affect the estimation of the fixed effect coefficient? summary(m_fixed)$coefficients ## Estimate Std. Error t value Pr(>|t|)
## (Intercept)  0.9567796  0.2039313  4.691676 9.080522e-06
## temp         2.0654349  0.1048368 19.701440 2.549792e-35
## month2       0.4307483  0.2862849  1.504614 1.357408e-01
## month3       1.2649599  0.2772677  4.562233 1.511379e-05
## month4      -0.8925088  0.2789932 -3.199035 1.874375e-03

summary(m_fixedrand)$coefficients

##               Estimate Std. Error    t value
## (Intercept)  0.9567796  0.4525224  2.1143256
## temp         2.0654349  0.1048368 19.7014396
## month2       0.4307483  0.6390118  0.6740851
## month3       1.2649599  0.6350232  1.9919901
## month4      -0.8925088  0.6357784 -1.4038048

#the numeric response is not affected but the standard error around the intercept and the month coefficient is doubled, this makes it less likely that a significant p-value will be given for these effect ie higher chance to infer that there is no month effect when there is some

#and what if we simulate data as is supposed by the model, ie a fixed effect of month and on top of it we add a random component
rnd.eff<-rnorm(4,0,1.2)
mus<-modmat%*%eff+rnd.eff[data$month]
data$biom2<-rnorm(100,mus,1)
#an lmm model
m_fixedrand2<-lmer(biom2~temp+month+(1|month),data)
fixef(m_fixedrand2) #weird coeff values for the fixed effect for month

## (Intercept)        temp      month2      month3      month4 
##   -2.064083    2.141428    1.644968    4.590429    3.064715

c(0,eff[3:5])+rnd.eff #if we look at the intervals between the intercept and the different levels we can realize that the fixed effect part of the model sucked in the added random part

## [1] -2.66714133 -1.26677658  1.47977624  0.02506236

VarCorr(m_fixedrand2)

##  Groups   Name        Std.Dev.
##  month    (Intercept) 0.74327 
##  Residual             0.93435

ranef(m_fixedrand2) #again very VERY small

## $month
##     (Intercept)
## 1  1.378195e-15
## 2  7.386264e-15
## 3 -2.118975e-14
## 4 -7.752347e-15

#so this is basically not working it does not make sense to have a grouping factor as both a fixed effect terms and a random term (ie on the right-hand side of the |)

Take-home message don’t put a grouping factor as both a fixed and random term effect in your mixed effect model. lmer is not able to separate between the fixed and random part of the effect (and I don’t know how it could be done) and basically gives everything to the fixed effect leaving very small random effects. The issue is abit pernicious because if you would only look at the standard deviation of the random term from the merMod summary output you could not have guessed that something is wrong. You need to actually look at the random effects to realize that they are incredibely small. So beware when building complex models with many fixed and random terms to always check the estimated random effects.

The second issue is maybe a bit older but I saw it appear in a recent paper (which is a cool one excpet for this stats detail). After fitting a model with several predictors one wants to plot their effects on the response, some people use partial residuals plot to do this (wiki). The issue with these plots is that when two variables have a high covariance the partial residual plot will tend to be over-optimistic concerning the effect of variable X on Y (ie the plot will look much nice than it should be). Again let’s do a little simulation on this:


library(MASS)
set.seed(20150830)
#say we measure plant biomass in relation with measured temperature and number of sunny hours say per week
#the variance-covariance matrix between temperature and sunny hours
sig<-matrix(c(2,0.7,0.7,10),ncol=2,byrow=TRUE)
#simulate some data
xs<-mvrnorm(100,c(5,50),sig)
data<-data.frame(temp=xs[,1],sun=xs[,2])
modmat<-model.matrix(~temp+sun,data)
eff<-c(1,2,0.2)
data$biom<-rnorm(100,modmat%*%eff,0.7)

m<-lm(biom~temp+sun,data)
sun_new<-data.frame(sun=seq(40,65,length=20),temp=mean(data$temp))
#partial residual plot of sun
sun_res<-resid(m)+coef(m)[3]*data$sun
plot(data$sun,sun_res,xlab="Number of sunny hours",ylab="Partial residuals of Sun")
lines(sun_new$sun,coef(m)[3]*sun_new$sun,lwd=3,col="red")

Annoy1


#plot of sun effect while controlling for temp
pred_sun<-predict(m,newdata=sun_new)
plot(biom~sun,data,xlab="Number of sunny hours",ylab="Plant biomass")
lines(sun_new$sun,pred_sun,lwd=3,col="red")

Annoy2


#same stuff for temp
temp_new<-data.frame(temp=seq(1,9,length=20),sun=mean(data$sun))
pred_temp<-predict(m,newdata=temp_new)
plot(biom~temp,data,xlab="Temperature",ylab="Plant biomass")
lines(temp_new$temp,pred_temp,lwd=3,col="red")

Annoy3

The first graph is a partial residual plot, from this graph alone we would be tempted to say that the number of hour with sun has a large influence on the biomass. This conclusion is biased by the fact that the number of sunny hours covary with temperature and temperature has a large influence on plant biomass. So who is more important temperature or sun? The way to resolve this is to plot the actual observation and to add a fitted regression line from a new dataset (sun_new in the example) where one variable is allowed to vary while all others are fixed to their means. This way we see how an increase in the number of sunny hour at an average temperature affect the biomass (the second figure). The final graph is then showing the effect of temperature while controlling for the effect of the number of sunny hours.

Happy modelling!

Filed under: R and Stat Tagged: lme4, R, residuals

To leave a comment for the author, please follow the link and comment on his blog: biologyforfun » R.

R-bloggers.com offers daily e-mail updates about R news and tutorials on topics such as: visualization (ggplot2, Boxplots, maps, animation), programming (RStudio, Sweave, LaTeX, SQL, Eclipse, git, hadoop, Web Scraping) statistics (regression, PCA, time series, trading) and more...

Looking after Datasets

$
0
0

(This article was first published on Revolutions, and kindly contributed to R-bloggers)

by Antony Unwin
University of Augsburg, Germany


David Moore's definition of data: numbers that have been given a context.

Here is some context for the finch dataset:

Darwin's_finches_by_Gould

Fig 1: Illustrations of the beaks of four of Darwin's finches from "The Voyage of the Beagle".  Note that only one of these (fortis) is included in the dataset.

R's package system is one of it great strengths, offering powerful additional capabilities of all kinds and including many interesting real datasets.  Of course not all packages are as good as they might be, and as Bill Venables memorably put it on R-help in 2007: "Most packages are very good, but I regret to say some are pretty inefficient and others downright dangerous."  So you have to treat any packages with care ("caveat downloader", as the R-omans might have said) and any datasets supplied must be handled carefully too.

You might think that supplying a dataset in an R package would be a simple matter:  You include the file, you write a short general description mentioning the background and giving the source, you define the variables.  Perhaps you provide some sample analyses and discuss the results briefly.  Kevin Wright's agridat package is exemplary in these respects.

As it happens, there are a couple of other issues that turn out to be important.  Is the dataset or a version of it already in R and is the name you want to use for the dataset already taken?  At this point the experienced R user will correctly guess that some datasets have the same name but are quite different (e.g., movies, melanoma) and that some datasets appear in many different versions under many different names.  The best example I know is the Titanic dataset, which is availble in the datasets package.  You will also find titanic (COUNT, prLogistic, msme), titanic.dat (exactLoglinTest), titan.Dat (elrm), titgrp (COUNT), etitanic (earth), ptitanic (rpart.plot), Lifeboats (vcd), TitanicMat (RelativeRisk), Titanicp (vcdExtra), TitanicSurvival (effects), Whitestar (alr4), and one package, plotrix, includes a manually entered version of the dataset in one of its help examples. The datasets differ on whether the crew is included or not, on the number of cases, on information provided, on formatting, and on discussion, if any, of analyses. Versions with the same names in different packages are not identical.  There may be others I have missed.

The issue came up because I was looking for a dataset of the month for the website of my book "Graphical Data Analysis with R".  The plan is to choose a dataset from one of the recently released or revised R packages and publish a brief graphical analysis to illustrate and reinforce the ideas presented in the book while showing some interesting information about the data.  The dataset finch in dynRB looked rather nice: five species of finch with nine continuous variables and just under 150 cases.  It looked promising and what’s more it is related to Darwin’s work and there was what looked like an original reference from 1904.

Figure 2 shows the distribution of species:

Fig2SpeciesDistrib

Fig 2: The numbers of birds of the five different species in the dataset.  The distribution is a little unbalanced with over half the birds being from one species, but that is real data for you.

Some of the variable names are clear enough (TailL must be the length of the tail), but what on earth could N.UBkL be?  The help for the dataset only says it is a numeric vector.  As a first resort I tried to find the 1904 reference on the web and it was surprisingly easy.  The complete book is available and searchable from Cornell University Library.  N.UBkL must be 'Maxilla from Nostril', i.e. the distance from nose to upper beak — obvious in retrospect really.

Naturally, once you have an original source in front of you, you explore a bit more.  It turns out that the dataset only includes the birds found on one island, although the species may be found on more than one.  That is OK (although the package authors could have told us).  All cases with any missing values have been dropped (9 out of 155).  You can understand why that might have been done (methods cannot handle missing values?), but mentioning it would have been nice.  Information is available on sex for each bird in the original, but is not included in the dataset.  Perhaps sex is not so relevant for their studies, but surely potentially very interesting to others.  It is possible that the dataset was actually passed on to the authors by someone else and the authors themselves never looked at the original source.  This would be by no means unusual in academic circles (sadly).

There is an extensive literature on Darwin's finches (which incidentally are not finches at all) and a key feature differentiating the species is the beak, as you can see in Fig 1.  We can explore differences between species beaks more quantitatively by displaying the data in a suitable way:

Fig3FinchPCP

Fig 3: A parallel coordinate plot of the nine measurements made on each bird with the five species distinguished by colour.  The first two beak variables (BeakW and BeakH) separate the two bigger species from the other three.  The following three variables (LBeakL, UBeakL, and N.UBkL) separate the smaller species from one another.

Could the two bigger species be separated from one another using some discrimination analysis or some machine learning technique?  Possibly, I have not tried, but it is worth noting that these two species are considered to be two subspecies of the same species, so demonstrable differences are not so likely.

If you have got this far, you will realise that I am grateful to the package authors for providing this dataset in R and I appreciate their efforts.  I just wish they had made a little more effort.  When you think of how much care and effort went into collecting the real datasets we use (how long would it take you to collect so many birds, classify them and measure them?), we should take more trouble in looking after datasets and offer the original collectors of the data more respect and gratitude.

This is all true of so many datasets in R and you begin to wonder if there should not be a society for the protection of datasets (SPODS?).  That might prevent them being so abused and maltreated.  Far worse has been done to datasets in R than anything I have detailed here, but this is a family blog and details of graver abuses might upset sensitive readers.

To end on an optimistic note, some further googling led to the discovery of the complete data from the 1904 reference for all the species (there are not just 5 taxa, but 32) for all the Galapogos islands, with the sex variable, and with the cases with missing values.  The source was the Dryad Digital Repository, a site I confess that was unknown to me. "The Dryad Digital Repository is a curated resource that makes the data underlying scientific publications discoverable, freely reusable, and citable."  Sounds good, we should encourage more sites like that, and we should encourage providers of datasets in R to look after any data in their care better.

And returning to Moore's definition of data, wouldn't it be a help to distinguish proper datasets from mere sets of numbers in R?

To leave a comment for the author, please follow the link and comment on his blog: Revolutions.

R-bloggers.com offers daily e-mail updates about R news and tutorials on topics such as: visualization (ggplot2, Boxplots, maps, animation), programming (RStudio, Sweave, LaTeX, SQL, Eclipse, git, hadoop, Web Scraping) statistics (regression, PCA, time series, trading) and more...

Correction For Spatial And Temporal Auto-Correlation In Panel Data: Using R To Estimate Spatial HAC Errors Per Conley

$
0
0

(This article was first published on fReigeist » R, and kindly contributed to R-bloggers)

Darin Christensen and Thiemo Fetzer


tl;dr: Fast computation of standard errors that allows for serial and spatial auto-correlation.


Economists and political scientists often employ panel data that track units (e.g., firms or villages) over time. When estimating regression models using such data, we often need to be concerned about two forms of auto-correlation: serial (within units over time) and spatial (across nearby units). As Cameron and Miller (2013) note in their excellent guide to cluster-robust inference, failure to account for such dependence can lead to incorrect conclusions: “[f]ailure to control for within-cluster error correlation can lead to very misleadingly small standard errors…” (p. 4).

Conley (1999, 2008) develops one commonly employed solution. His approach allows for serial correlation over all (or a specified number of) time periods, as well as spatial correlation among units that fall within a certain distance of each other. For example, we can account for correlated disturbances within a particular village over time, as well as between that village and every other village within one hundred kilometers. As with serial correlation, spatial correlation can be positive or negative. It can be made visually obvious by plotting, for example, residuals after removing location fixed effects.

Example Visualization of Spatial Correlation

Example Visualization of Spatial Correlation from Radil, S. Matthew, Spatializing Social Networks: Making Space for Theory In Spatial Analysis, 2011.

We provide a new function that allows R users to more easily estimate these corrected standard errors. (Solomon Hsiang (2010) provides code for STATA, which we used to test our estimates and benchmark speed.) Moreover using the excellent lfe, Rcpp, and RcppArmadillo packages (and Tony Fischetti’s Haversine distance function), our function is roughly 20 times faster than the STATA equivalent and can scale to handle panels with more units. (We have used it on panel data with over 100,000 units observed over 6 years.)

This demonstration employs data from Fetzer (2014), who uses a panel of U.S. counties from 1999-2012. The data and code can be downloaded here.


STATA Code:

We first use Hsiang’s STATA code to compute the corrected standard errors (spatHAC in the output below). This routine takes just over 25 seconds.

cd "~/Dropbox/ConleySEs/Data"
clear; use "new_testspatial.dta"

tab year, gen(yy_)
tab FIPS, gen(FIPS_)

timer on 1
ols_spatial_HAC EmpClean00 HDD yy_*FIPS_2-FIPS_362, lat(lat ) lon(lon ) t(year) p(FIPS) dist(500) lag(5) bartlett disp

# *-----------------------------------------------
# *    Variable |   OLS      spatial    spatHAC
# *-------------+---------------------------------
# *         HDD |   -0.669     -0.669     -0.669
# *             |    0.608      0.786      0.838

timer off 1
timer list 1
#  1:     24.8 /        3 =      8.2650

R Code:

Using the same data and options as the STATA code, we then estimate the adjusted standard errors using our new R function. This requires us to first estimate our regression model using the felm function from the lfe package.

# Loading sample data:
dta_file <- "~/Dropbox/ConleySEs/Data/new_testspatial.dta"
DTA <-data.table(read.dta(dta_file))
setnames(DTA, c("latitude", "longitude"), c("lat", "lon"))

# Loading R function to compute Conley SEs:
source("~/Dropbox/ConleySEs/ConleySEs_17June2015.R")

ptm <-proc.time()

# We use the felm() from the lfe package to estimate model with year and county fixed effects.
# Two important points:
# (1) We specify our latitude and longitude coordinates as the cluster variables, so that they are included in the output (m).
# (2) We specify keepCx = TRUE, so that the centered data is included in the output (m).

m <-felm(EmpClean00 ~HDD -1 |year +FIPS |0 |lat +lon,
  data = DTA[!is.na(EmpClean00)], keepCX = TRUE)

coefficients(m) %>%round(3) # Same as the STATA result.
   HDD 
-0.669 

We then feed this model to our function, as well as the cross-sectional unit (county FIPS codes), time unit (year), geo-coordinates (lat and lon), the cutoff for serial correlation (5 years), the cutoff for spatial correlation (500 km), and the number of cores to use.

SE <-ConleySEs(reg = m,
    unit = "FIPS", 
    time = "year",
    lat = "lat", lon = "lon",
    dist_fn = "SH", dist_cutoff = 500, 
    lag_cutoff = 5,
    cores = 1, 
    verbose = FALSE) 

sapply(SE, sqrt) %>%round(3) # Same as the STATA results.
        OLS     Spatial Spatial_HAC 
      0.608       0.786       0.837 
proc.time() -ptm
   user  system elapsed 
  1.619   0.055   1.844 

Estimating the model and computing the standard errors requires just over 1 second, making it over 20 times faster than the comparable STATA routine.


R Using Multiple Cores:

Even with a single core, we realize significant speed improvements. However, the gains are even more dramatic when we employ multiple cores. Using 4 cores, we can cut the estimation of the standard errors down to around 0.4 seconds. (These replications employ the Haversine distance formula, which is more time-consuming to compute.)

pkgs <-c("rbenchmark", "lineprof")
invisible(sapply(pkgs, require, character.only = TRUE))

bmark <-benchmark(replications = 25,
  columns = c('replications','elapsed','relative'),
  ConleySEs(reg = m,
    unit = "FIPS", time = "year", lat = "lat", lon = "lon",
    dist_fn = "Haversine", lag_cutoff = 5, cores = 1, verbose = FALSE),
  ConleySEs(reg = m,
    unit = "FIPS", time = "year", lat = "lat", lon = "lon",
    dist_fn = "Haversine", lag_cutoff = 5, cores = 2, verbose = FALSE),
  ConleySEs(reg = m,
    unit = "FIPS", time = "year", lat = "lat", lon = "lon",
    dist_fn = "Haversine", lag_cutoff = 5, cores = 4, verbose = FALSE))
bmark %>%mutate(avg_eplased = elapsed /replications, cores = c(1, 2, 4))
  replications elapsed relative avg_eplased cores
1           25   23.48    2.095      0.9390     1
2           25   15.62    1.394      0.6249     2
3           25   11.21    1.000      0.4483     4

Given the prevalence of panel data that exhibits both serial and spatial dependence, we hope this function will be a useful tool for applied econometricians working in R.


Feedback Appreciated: Memory vs. Speed Tradeoff

This was Darin’s first foray into C++, so we welcome feedback on how to improve the code. In particular, we would appreciate thoughts on how to overcome a memory vs. speed tradeoff we encountered. (You can email Darin at darinc[at]stanford.edu.)

The most computationally intensive chunk of our code computes the distance from each unit to every other unit. To cut down on the number of distance calculations, we can fill the upper triangle of the distance matrix and then copy it to the lower triangle. With [math]N[/math] units, this requires only  [math](N (N-1) /2)[/math] distance calculations.

However, as the number of units grows, this distance matrix becomes too large to store in memory, especially when executing the code in parallel. (We tried to use a sparse matrix, but this was extremely slow to fill.) To overcome this memory issue, we can avoid constructing a distance matrix altogether. Instead, for each unit, we compute the vector of distances from that unit to every other unit. We then only need to store that vector in memory. While that cuts down on memory use, it requires us to make twice as many   [math](N (N-1))[/math]  distance calculations.

As the number of units grows, we are forced to perform more duplicate distance calculations to avoid memory constraints – an unfortunate tradeoff. (See the functions XeeXhC and XeeXhC_Lg in ConleySE.cpp.)


sessionInfo()
R version 3.2.2 (2015-08-14)
Platform: x86_64-apple-darwin13.4.0 (64-bit)
Running under: OS X 10.10.4 (Yosemite)

locale:
[1] en_GB.UTF-8/en_GB.UTF-8/en_GB.UTF-8/C/en_GB.UTF-8/en_GB.UTF-8

attached base packages:
[1] stats     graphics  grDevices utils     datasets  methods  
[7] base     

other attached packages:
 [1] RcppArmadillo_0.5.400.2.0 Rcpp_0.12.0              
 [3] geosphere_1.4-3           sp_1.1-1                 
 [5] lfe_2.3-1709              Matrix_1.2-2             
 [7] ggplot2_1.0.1             foreign_0.8-65           
 [9] data.table_1.9.4          dplyr_0.4.2              
[11] knitr_1.11               

loaded via a namespace (and not attached):
 [1] Formula_1.2-1    magrittr_1.5     MASS_7.3-43     
 [4] munsell_0.4.2    xtable_1.7-4     lattice_0.20-33 
 [7] colorspace_1.2-6 R6_2.1.1         stringr_1.0.0   
[10] plyr_1.8.3       tools_3.2.2      parallel_3.2.2  
[13] grid_3.2.2       gtable_0.1.2     DBI_0.3.1       
[16] htmltools_0.2.6  yaml_2.1.13      assertthat_0.1  
[19] digest_0.6.8     reshape2_1.4.1   formatR_1.2     
[22] evaluate_0.7.2   rmarkdown_0.8    stringi_0.5-5   
[25] compiler_3.2.2   scales_0.2.5     chron_2.3-47    
[28] proto_0.3-10    

To leave a comment for the author, please follow the link and comment on his blog: fReigeist » R.

R-bloggers.com offers daily e-mail updates about R news and tutorials on topics such as: visualization (ggplot2, Boxplots, maps, animation), programming (RStudio, Sweave, LaTeX, SQL, Eclipse, git, hadoop, Web Scraping) statistics (regression, PCA, time series, trading) and more...

How do you know if your model is going to work? Part 1: The problem

$
0
0

(This article was first published on Win-Vector Blog » R, and kindly contributed to R-bloggers)

Authors: John Mount (more articles) and Nina Zumel (more articles).

“Essentially, all models are wrong, but some are useful.”


George Box

Here’s a caricature of a data science project: your company or client needs information (usually to make a decision). Your job is to build a model to predict that information. You fit a model, perhaps several, to available data and evaluate them to find the best. Then you cross your fingers that your chosen model doesn’t crash and burn in the real world.

We’ve discussed detecting if your data has a signal. Now: how do you know that your model is good? And how sure are you that it’s better than the models that you rejected?


Bartolomeu Velho 1568
Geocentric illustration Bartolomeu Velho, 1568 (Bibliothèque Nationale, Paris)

Notice the Sun in the 4th revolution about the earth. A very pretty, but not entirely reliable model.

In this latest “Statistics as it should be” series, we will systematically look at what to worry about and what to check. This is standard material, but presented in a “data science” oriented manner. Meaning we are going to consider scoring system utility in terms of service to a negotiable business goal (one of the many ways data science differs from pure machine learning).

To organize the ideas into digestible chunks, we are presenting this article as a four part series. This part (part 1) sets up the specific problem.

Read more.

Our example problem

Let’s use a single example to make things concrete. We have used the 2009 KDD Cup dataset to demonstrate estimating variable significance, so we will use it again here to demonstrate model evaluation. The contest task was supervised machine learning. The goal was to build scores that predict things like churn (account cancellation) from a data set consisting of about 50,000 rows (representing credit card accounts) and 234 variables (both numeric and categorical facts about the accounts). An IBM group won the contest with an AUC (“area under the curve”) of 0.76 in predicting churn on held-out data. Using R we can get an AUC of 0.71 on our own hold-out set (meaning we used less data for training) using automated variable preparation, standard gradient boosting, and essentially no parameter tuning (which itself can be automated as it is in packages such as caret).

Obviously a 0.71 AUC would not win the contest. But remember the difference between 0.76 and 0.71 may or may not be statistically significant (something we will touch on in this article) and may or may not make a business difference. Typically a business combines a score with a single threshold to convert it into an operating classifier or decision procedure. The threshold is chosen as a business driven compromise between domain driven precision and recall (or sensitivity and specificity) goals. Businesses do not directly experience AUC which summarizes facts about the classifiers the score would induce at many different threshold levels (including ones that are irrelevant to the business). A scoring system whose ROC curve contains another scoring system’s ROC curve is definitely the better classifier, but small increases in AUC don’t always ensure such containment. AUC is an acceptable proxy score when choosing among classifiers (however, it does not have a non-strained reasonable probabilistic interpretation, despite such claims), and it should not be your final business metric.

For this article, however- we will stick with the score evaluation measures: deviance and AUC. But keep in mind that in an actual data science project you are much more likely to quickly get a reliable 0.05 increase in AUC by working with your business partners to transform, clean, or find more variables- than by tuning your post-data- collection machine learning procedure. So we feel score tuning is already over-emphasized and don’t want to dwell too much more on it here.

Choice of utility metric

One way a data science project differs from a machine learning contest is that the choice of score or utility metric is an important choice made by the data scientist, and not a choice supplied by a competition framework. The metric or score must map to utility for the business client. The business goal in supervised machine learning project is usually either classification (picking a group of accounts at higher risk of churn) or sorting (ordering accounts by predicted risk).

Choice of experimental design, data preparation, and choice of metric can be a big driver of project success or failure. For example in hazard models (such as predicting churn) the items that are easiest to score are items that have essentially already happened. You may have call-center code that encodes “called to cancel” as one of your predictive signals. Technically it is a great signal, the person certainly hasn’t cancelled prior to the end of the call. But it is useless to the business. The data-scientist has to help re-design the problem definition and data curation to focus in on customers that are going to cancel soon, but to indicate some reasonable time before they cancel (see here for more on the issue). The business goal is to change the problem to a more useful business problem that may induce a harder machine learning problem. The business goal is not to do as well as possible on a single unchanging machine learning problem.

If the business needs a decision procedure: then part of the project is picking a threshold that converts the scoring system into a classifier. To do this you need some sort of business sensitive pricing of true-positives, false-positives, true-negatives, and false-negatives or working out appropriate trade-offs between precision and recall. While tuning scoring procedures we suggest using one of deviance or AUC as a proxy measure until you are ready to try converting your score into a classifier. Deviance has the advantage that it has nice interpretations in terms of log-likelihood and entropy, and AUC has the advantage that is invariant under any one-to-one monotone transformation of your score.

A classifier is best evaluated with precision and recall or sensitivity and specificity. Order evaluation is best done with an AUC-like score such as the Gini coefficient or even a gain curve.

A note on accuracy

In most applications the cost of false-positives (accounts the classifier thinks will churn, but do not) is usually very different than the cost of false-negatives (accounts the classifier things will not churn, but do). This means a measure that prices these two errors identically is almost never the right final utility score. Accuracy is exactly one such measure. You must understand most business partners ask for “accurate” classifiers only because it may be the only term they are familiar with. Take the time to discuss appropriate utility measures with your business partners.

Here is an example to really drive the point home. The KDD2009 data set had a churn rate of around 7%. Consider the following two classifiers. Classifier A that predicts “churn” on 21% of the data but captures all of the churners in its positive predictions. Classifier B that predicts “no churn” on all data. Classifier A is wrong 14% of the time and thus has an accuracy of 86%. Classifier B is wrong 7% of the time and thus has an accuracy of 93% and is the more accurate classifier. Classifier A is a “home run” in a business sense (it has recall 1.0 and precision 33%!), Classifier B is absolutely useless. See here, for more discussion on this issue.

The issues

In all cases we are going to pick a utility score or statistic. We want to estimate the utility of our model on future data (as our model will hopefully be used on new data in the future). The performance of our model in the future is usually an unknowable quantity. However, we can try to estimate this unknowable quantity by an appeal to the idea of exchangeability. If we had a set of test data that was exchangeable with the unknown future data, then an estimate of our utility on this test set should be a good estimate of future behavior. A similar way to get at this is if future data were independent and identically distributed with the test data then we again could expect to make an estimate.

The issues we run into in designing an estimate of model utility include at least the following:

  • Are we attempting to evaluate an actual score or the procedure for building scores? These are two related, but different questions.
  • Are we deriving a single point estimate or a distribution of estimates? Are we estimating sizes of effects, significances, or both?
  • Are we using data that was involved in the training procedure (which breaks exchangeability!) or fresh data?

Your answers to these questions determine what procedures you should try.

Scoring Procedures

We are going to work through a good number of the available testing and validation procedures. There is no “one true” procedure, so you need to get used to having more than one method to choose from. We suggest you go over each of the upcoming graphs with a ruler and see what conclusions you can draw about the relative utility of each of the models we are demonstrating.

Naive methods

No measure

The no-measure procedure is the following: pick a good machine learning procedure, use it to fit the data, and turn that in as your solution. In principle nobody is ever so ill mannered to do this.

However, if you only try one modeling technique and don’t base any decision on your measure or score- how does that differ from having made no measurement? Suppose we (as in this R example) only made one try of Random Forest on the KDD2009 problem? We could present our boss with a ROC graph like the following:

NewImage

Because we only tried one model the only thing our boss can look for is the AUC above 0.5 (uselessness) or not. They have no idea if 0.67 is large or small. Since or AUC measure drove no decision, it essentially was no measurement.

So at the very least we need to set a sense of scale. We should at least try more than one model.

Model supplied diagnostics

If we are going to try more than one model, we run into the problem that each model reports different diagnostics. Random forest tends to report error rates, logistic regression reports deviance, GBM reports variable importance. At this point you find you need to standardize on your own quality of score measure and run your own (or library code) on all models.

Next

Now that we have framed the problem, we will continue this series with:

  • Part 2: In-training set measures
  • Part 3: Out of sample procedures
  • Part 4: Cross-validation techniques

The goal is to organize the common procedures into a coherent guide. As we work through the ideas all methods will be shared as R code here.

To leave a comment for the author, please follow the link and comment on his blog: Win-Vector Blog » R.

R-bloggers.com offers daily e-mail updates about R news and tutorials on topics such as: visualization (ggplot2, Boxplots, maps, animation), programming (RStudio, Sweave, LaTeX, SQL, Eclipse, git, hadoop, Web Scraping) statistics (regression, PCA, time series, trading) and more...

Free R Help

$
0
0

(This article was first published on AriLamstein.com » R, and kindly contributed to R-bloggers)

Today I am giving away 10 sessions of free, online, one-on-one R help. My hope is to get a better understanding of how my readers use R, and the issues they face when working on their own projects. The sessions will be over the next two weeks, online and 30-60 minutes each. I just purchased Screenhero, which will allow me to screen share during the sessions.

If you would like to reserve a session then please contact me using this form and describe the project that you want help with.  It can be anything, really. But here are some niches within R that I have a lot of experience with:

  • Packages that I have created
  • Analyzing web site data using R and MySQL
  • Exploratory data analysis using ggplot2, dplyr, etc.
  • Creating apps with Shiny
  • Creating reports using RMarkdown and knitr
  • Developing your own R package
  • Working with shapefiles in R
  • Working with public data sets
  • Marketing R packages

Parting Image

I’ve included an image, plus the code to create it, in every blog post I’ve done. I’d hate to stop now just because of the free giveaway. So here’s a comparison of two ways to view the distribution  Per Capita Income in the Census Tracts of Orange County, California:

orange-county-tract-income

On the right is a boxplot of the data, which shows the distribution of the values. On the left is a choropleth, which shows us where the values are. The choropleth uses a continuous scale, which highlights outliers. Here is the code to create the map. Note that the choroplethrCaCensusTract package is on github, not CRAN.

library(choroplethrCaCensusTract)
data(df_ca_tract_demographics)
df_ca_tract_demographics$value = df_ca_tract_demographics$per_capita_income

choro = ca_tract_choropleth(df_ca_tract_demographics, 
                            legend      = "Dollars",
                            num_colors  = 1,
                            county_zoom = 6059)

library(ggplot2)
library(scales)
bp = ggplot(df_ca_tract_demographics, aes(value, value)) +
  geom_boxplot() + 
  theme(axis.text.x = element_blank()) +
  labs(x = "", y = "Dollars") +
  scale_y_continuous(labels=comma)

library(gridExtra)
grid.arrange(top = "Orange County, CalifornianCensus Tracts, Per Capita Income", 
            choro, 
            bp, 
            ncol = 2)

LEARN TO MAP CENSUS DATA
Subscribe and get my free email course: Mapping Census Data in R!
100% Privacy. We don’t spam.


The post Free R Help appeared first on AriLamstein.com.

To leave a comment for the author, please follow the link and comment on his blog: AriLamstein.com » R.

R-bloggers.com offers daily e-mail updates about R news and tutorials on topics such as: visualization (ggplot2, Boxplots, maps, animation), programming (RStudio, Sweave, LaTeX, SQL, Eclipse, git, hadoop, Web Scraping) statistics (regression, PCA, time series, trading) and more...

Bootstrap Evaluation of Clusters

$
0
0

(This article was first published on Win-Vector Blog » R, and kindly contributed to R-bloggers)


NewImage
Illustration from Project Gutenberg

The goal of cluster analysis is to group the observations in the data into clusters such that every datum in a cluster is more similar to other datums in the same cluster than it is to datums in other clusters. This is an analysis method of choice when annotated training data is not readily available. In this article, based on chapter 8 of Practical Data Science with R, the authors discuss one approach to evaluating the clusters that are discovered by a chosen clustering method.

An important question when evaluating clusters is whether a given cluster is “real”-does the cluster represent actual structure in the data, or is it an artifact of the clustering algorithm? This is especially important with clustering algorithms like k-means, where the user has to specify the number of clusters a priori. It’s been our experience that clustering algorithms will often produce several clusters that represent actual structure or relationships in the data, and then one or two clusters that are buckets that represent “other” or “miscellaneous.” Clusters of “other” tend to be made up of data points that have no real relationship to each other; they just don’t fit anywhere else.

One way to assess whether a cluster represents true structure is to see if the cluster holds up under plausible variations in the dataset. The fpc package has a function called clusterboot()that uses bootstrap resampling to evaluate how stable a given cluster is. (For a full description of the algorithm, see Christian Henning, “Cluster-wise assessment of cluster stability,” Research Report 271, Dept. of Statistical Science, University College London, December 2006). clusterboot() is an integrated function that both performs the clustering and evaluates the final produced clusters. It has interfaces to a number of R clustering algorithms, including both hclust and kmeans.

clusterboot‘s algorithm uses the Jaccard coefficient, a similarity measure between sets. The Jaccard similarity between two sets A and B is the ratio of the number of elements in the intersection of A and B over the number of elements in the union of A and B. The basic general strategy is as follows:

  1. Cluster the data as usual.
  2. Draw a new dataset (of the same size as the original) by resampling the original dataset with replacement (meaning that some of the data points may show up more than once, and others not at all). Cluster the new dataset.
  3. For every cluster in the original clustering, find the most similar cluster in the new clustering (the one that gives the maximum Jaccard coefficient) and record that value. If this maximum Jaccard coefficient is less than 0.5, the original cluster is considered to be dissolved-it didn’t show up in the new clustering. A cluster that’s dissolved too often is probably not a “real” cluster.
  4. Repeat steps 2-3 several times.

The cluster stability of each cluster in the original clustering is the mean value of its Jaccard coefficient over all the bootstrap iterations. As a rule of thumb, clusters with a stability value less than 0.6 should be considered unstable. Values between 0.6 and 0.75 indicate that the cluster is measuring a pattern in the data, but there isn’t high certainty about which points should be clustered together. Clusters with stability values above about 0.85 can be considered highly stable (they’re likely to be real clusters).

Different clustering algorithms can give different stability values, even when the algorithms produce highly similar clusterings, so clusterboot() is also measuring how stable the clustering algorithm is.

The protein dataset

To demonstrate clusterboot(), we’ll use a small dataset from 1973 on protein consumption from nine different food groups in 25 countries in Europe. The original dataset can be found here. A tab-separated text file with the data can be found in this directory. The data file is called protein.txt; additional information can be found in the file protein_README.txt.

The goal is to group the countries based on patterns in their protein consumption. The dataset is loaded into R as a data frame called protein, as shown in the next listing.

protein <- read.table("protein.txt", sep="t", header=TRUE)
summary(protein)
#           Country      RedMeat         WhiteMeat           Eggs
# Albania       : 1   Min.   : 4.400   Min.   : 1.400   Min.   :0.500
# Austria       : 1   1st Qu.: 7.800   1st Qu.: 4.900   1st Qu.:2.700
# Belgium       : 1   Median : 9.500   Median : 7.800   Median :2.900
# Bulgaria      : 1   Mean   : 9.828   Mean   : 7.896   Mean   :2.936
# Czechoslovakia: 1   3rd Qu.:10.600   3rd Qu.:10.800   3rd Qu.:3.700
# Denmark       : 1   Max.   :18.000   Max.   :14.000   Max.   :4.700
# (Other)       :19
#      Milk            Fish           Cereals          Starch
# Min.   : 4.90   Min.   : 0.200   Min.   :18.60   Min.   :0.600
# 1st Qu.:11.10   1st Qu.: 2.100   1st Qu.:24.30   1st Qu.:3.100
# Median :17.60   Median : 3.400   Median :28.00   Median :4.700
# Mean   :17.11   Mean   : 4.284   Mean   :32.25   Mean   :4.276
# 3rd Qu.:23.30   3rd Qu.: 5.800   3rd Qu.:40.10   3rd Qu.:5.700
# Max.   :33.70   Max.   :14.200   Max.   :56.70   Max.   :6.500
#
#      Nuts           Fr.Veg
# Min.   :0.700   Min.   :1.400
# 1st Qu.:1.500   1st Qu.:2.900
# Median :2.400   Median :3.800
# Mean   :3.072   Mean   :4.136
# 3rd Qu.:4.700   3rd Qu.:4.900
# Max.   :7.800   Max.   :7.900

#   Use all the columns except the first 
#   (Country). 
vars.to.use <- colnames(protein)[-1]         

# Scale the data columns to be zero mean 
# and unit variance.
# The output of scale() is a matricx.
pmatrix <- scale(protein[,vars.to.use])      

# optionally, store the centers and 
# standard deviations of the original data,
# so you can "unscale" it later.
pcenter <- attr(pmatrix, "scaled:center")  
pscale <- attr(pmatrix, "scaled:scale")

Before running clusterboot() we’ll cluster the data using a hierarchical clustering algorithm (Ward’s method):

#   Create the distance matrix.
d <- dist(pmatrix, method="euclidean") 
    
#   Do the clustering. 
pfit <- hclust(d, method="ward")   

#   Plot the dendrogram.
plot(pfit, labels=protein$Country)     

The dendrogram suggests five clusters, as shown in the figure below. You can draw the rectangles on the dendrogram using the command rect.hclust(pfit, k=5).

Dendrogram annotated

Let’s extract and print the clusters:

#   A convenience function for printing out the 
#   countries in each cluster, along with the values 
#   for red meat, fish, and fruit/vegetable 
#   consumption. 
print_clusters <- function(labels, k) {             
  for(i in 1:k) {
    print(paste("cluster", i))
    print(protein[labels==i,c("Country","RedMeat","Fish","Fr.Veg")])
  }
}

# get the cluster labels
groups <- cutree(pfit, k=5)

# --- results -- 

> print_clusters(groups, 5)
[1] "cluster 1"
      Country RedMeat Fish Fr.Veg
1     Albania    10.1  0.2    1.7
4    Bulgaria     7.8  1.2    4.2
18    Romania     6.2  1.0    2.8
25 Yugoslavia     4.4  0.6    3.2
[1] "cluster 2"
       Country RedMeat Fish Fr.Veg
2      Austria     8.9  2.1    4.3
3      Belgium    13.5  4.5    4.0
9       France    18.0  5.7    6.5
12     Ireland    13.9  2.2    2.9
14 Netherlands     9.5  2.5    3.7
21 Switzerland    13.1  2.3    4.9
22          UK    17.4  4.3    3.3
24   W Germany    11.4  3.4    3.8
[1] "cluster 3"
          Country RedMeat Fish Fr.Veg
5  Czechoslovakia     9.7  2.0    4.0
7       E Germany     8.4  5.4    3.6
11        Hungary     5.3  0.3    4.2
16         Poland     6.9  3.0    6.6
23           USSR     9.3  3.0    2.9
[1] "cluster 4"
   Country RedMeat Fish Fr.Veg
6  Denmark    10.6  9.9    2.4
8  Finland     9.5  5.8    1.4
15  Norway     9.4  9.7    2.7
20  Sweden     9.9  7.5    2.0
[1] "cluster 5"
    Country RedMeat Fish Fr.Veg
10   Greece    10.2  5.9    6.5
13    Italy     9.0  3.4    6.7
17 Portugal     6.2 14.2    7.9
19    Spain     7.1  7.0    7.2

There’s a certain logic to these clusters: the countries in each cluster tend to be in the same geographical region. It makes sense that countries in the same region would have similar dietary habits. You can also see that

  • Cluster 2 is made of countries with higher-than-average red meat consumption.
  • Cluster 4 contains countries with higher-than-average fish consumption but low produce consumption.
  • Cluster 5 contains countries with high fish and produce consumption.

Let’s run clusterboot() on the protein data, using hierarchical clustering with five clusters.

# load the fpc package
library(fpc)   

# set the desired number of clusters                               
kbest.p<-5       
                                                
#   Run clusterboot() with hclust 
#   ('clustermethod=hclustCBI') using Ward's method 
#   ('method="ward"') and kbest.p clusters 
#   ('k=kbest.p'). Return the results in an object 
#   called cboot.hclust.
cboot.hclust <- clusterboot(pmatrix,clustermethod=hclustCBI,
                           method="ward", k=kbest.p)

#   The results of the clustering are in 
#   cboot.hclust$result. The output of the hclust() 
#   function is in cboot.hclust$result$result. 
#
#   cboot.hclust$result$partition returns a 
#   vector of clusterlabels. 
groups<-cboot.hclust$result$partition  

# -- results --

> print_clusters(groups, kbest.p)                           
[1] "cluster 1"
      Country RedMeat Fish Fr.Veg
1     Albania    10.1  0.2    1.7
4    Bulgaria     7.8  1.2    4.2
18    Romania     6.2  1.0    2.8
25 Yugoslavia     4.4  0.6    3.2
[1] "cluster 2"
       Country RedMeat Fish Fr.Veg
2      Austria     8.9  2.1    4.3
3      Belgium    13.5  4.5    4.0
9       France    18.0  5.7    6.5
12     Ireland    13.9  2.2    2.9
14 Netherlands     9.5  2.5    3.7
21 Switzerland    13.1  2.3    4.9
22          UK    17.4  4.3    3.3
24   W Germany    11.4  3.4    3.8
[1] "cluster 3"
          Country RedMeat Fish Fr.Veg
5  Czechoslovakia     9.7  2.0    4.0
7       E Germany     8.4  5.4    3.6
11        Hungary     5.3  0.3    4.2
16         Poland     6.9  3.0    6.6
23           USSR     9.3  3.0    2.9
[1] "cluster 4"
   Country RedMeat Fish Fr.Veg
6  Denmark    10.6  9.9    2.4
8  Finland     9.5  5.8    1.4
15  Norway     9.4  9.7    2.7
20  Sweden     9.9  7.5    2.0
[1] "cluster 5"
    Country RedMeat Fish Fr.Veg
10   Greece    10.2  5.9    6.5
13    Italy     9.0  3.4    6.7
17 Portugal     6.2 14.2    7.9
19    Spain     7.1  7.0    7.2

# The vector of cluster stabilities. 
# Values close to 1 indicate stable clusters
> cboot.hclust$bootmean                                   
[1] 0.7905000 0.7990913 0.6173056 0.9312857 0.7560000

# The count of how many times each cluster was 
# dissolved. By default clusterboot() runs 100 
# bootstrap iterations. 
# Clusters that are dissolved often are unstable. 
> cboot.hclust$bootbrd                                    
[1] 25 11 47  8 35

The above results show that the cluster of countries with high fish consumption (cluster 4) is highly stable (cluster stability = 0.93). Clusters 1 and 2 are also quite stable; cluster 5 (cluster stability 0.76) less so. Cluster 3 (cluster stability 0.62) has the characteristics of what we’ve been calling the “other” cluster. Note that clusterboot() has a random component, so the exact stability values and number of times each cluster is dissolved will vary from run to run.

Based on these results, we can say that the countries in cluster 4 have highly similar eating habits, distinct from those of the other countries (high fish and red meat consumption, with a relatively low amount of fruits and vegetables); we can also say that the countries in clusters 1 and 2 represent distinct eating patterns as well. The countries in cluster 3, on the other hand, show eating patterns that are different from those of the countries in other clusters, but aren’t as strongly similar to each other.

The clusterboot() algorithm assumes that you have the number of clusters, k. Obviously, determining k will be harder for datasets that are larger than our protein example. There are ways of estimating k, but they are beyond the scope of this article. Once you have an idea of the number of clusters, however, clusterboot() is a useful tool for evaluating the strength of the patterns that you have discovered.

For more about clustering, please refer to our free sample chapter 8 of Practical Data Science with R.

To leave a comment for the author, please follow the link and comment on his blog: Win-Vector Blog » R.

R-bloggers.com offers daily e-mail updates about R news and tutorials on topics such as: visualization (ggplot2, Boxplots, maps, animation), programming (RStudio, Sweave, LaTeX, SQL, Eclipse, git, hadoop, Web Scraping) statistics (regression, PCA, time series, trading) and more...

A quick look at BlueSky Statistics

$
0
0

(This article was first published on Revolutions, and kindly contributed to R-bloggers)

BlueSky Statistics is a new GUI-driven statistical data analysis tool for Windows. It provides a series of dialogs to import and manipluate data, and to perform statistical analysis and visualization tasks. (Think: more like SPSS than RStudio.) The underlying operations are implemented using R code, which you can inspect and reuse. This video gives you a more detailed introduction:


The basic version is open-source (here's the GitHub project), and you can download for free here. (There is also a paid Commercial Edition that adds technical support, some advanced statistics and machine learning dialogs, and the ability to extend the system with your own dialogs.) After you download and install, you'll also need to provide your own installation of R (Revolution R Open works too), and install the various packages that BlueSky needs to operate. (Packages for R/RRO 3.2.1 are provided with the download, and you can install them from a menu item.)

After you've installed BlueSky (look in your Documents folder for BlueSky.exe), the first step is to import some data using the File menu. In just a couple of minutes I was able to open a comma-separated file (airquality.csv in the Sample Datasets) folder and use the "Scatterplot" icon to create this chart:

BlueSky

I haven't had much of a chance to dive into the capabilities of BlueSky yet, so I'll leave a full review for a later date. If you've tried it yourself, let us know what you think in the comments.

BlueSky Statistics: Download

To leave a comment for the author, please follow the link and comment on his blog: Revolutions.

R-bloggers.com offers daily e-mail updates about R news and tutorials on topics such as: visualization (ggplot2, Boxplots, maps, animation), programming (RStudio, Sweave, LaTeX, SQL, Eclipse, git, hadoop, Web Scraping) statistics (regression, PCA, time series, trading) and more...

Spatstat – An introduction and measurements with Bio7

$
0
0

(This article was first published on » R, and kindly contributed to R-bloggers)

10.09.2015

Here I present a summary of a small spatstat workshop I created. I also explain in several videos how to transfer and convert 2d and 3D ImageJ measurements to a spatial point pattern with Bio7. The example datasets and code samples used here were taken from the spatstat help and from spatstat scripts cited at the end of the summary. The github repository with spatstat scripts, image scripts, documentation and more can be found here. I hope that this material is useful for others and helps in the creation of a spatial point pattern analysis with the fantastic spatstat package.

Spatstat

From the spatstat website:

‘spatstat is a package for analyzing spatial point pattern data. Its functionality includes exploratory data analysis, model-fitting, and simulation.’ (1)

The package supports:

  • creation, manipulation and plotting of point patterns
  • exploratory data analysis
  • simulation of point process models
  • parametric model-fitting
  • hypothesis tests and model diagnostic

Classes in spatstat

To handle point pattern datasets and related data, the spatstat package supports the following classes of objects:

  • ppp: planar point pattern
  • owin: spatial region (‘observation window’)
  • im: pixel image
  • psp: pattern of line segments
  • tess: tessellation
  • pp3: three-dimensional point pattern
  • ppx: point pattern in any number of dimensions
  • lpp: point pattern on a linear network

Creation of a point pattern object


A point pattern object can be created easily from x and y coordinates.

library (spatstat)
# some arbitrary coordinates in [0,1]
x <- runif(20)
y <- runif(20)
# the following are equivalent
X <- ppp(x, y, c(0,1), c(0,1))
X <- ppp(x, y)
X <- ppp(x, y, window=owin(c(0,1),c(0,1)))
# specify that the coordinates are given in metres
X <- ppp(x, y, c(0,1), c(0,1), unitname=c("metre","metres"))


Study region (window)

Many commands in spatstat require us to specify a window, study region or domain!

An object of class “owin” (‘observation window’) represents a region or window (rectangular, polygonal with holes, irregular) in two dimensional space.

Example:

w <- owin(c(0,1), c(0,1))
# the unit square
w <- owin(c(10,20), c(10,30), unitname=c("foot","feet"))
# a rectangle of dimensions 10 x 20 feet
# with lower left corner at (10,10)

# polygon (diamond shape)
w <- owin(poly=list(x=c(0.5,1,0.5,0),y=c(0,1,2,1)))
w <- owin(c(0,1), c(0,2), poly=list(x=c(0.5,1,0.5,0),y=c(0,1,2,1)))
# polygon with hole
  ho <- owin(poly=list(list(x=c(0,1,1,0), y=c(0,0,1,1)),
     list(x=c(0.6,0.4,0.4,0.6), y=c(0.2,0.2,0.4,0.4))))

plot(w)


plot(ho)


Task 1: Create a point pattern object from x,y data.

Task 2: Create a point pattern object within a specified window object.


Example dataset

data(swedishpines)
X<-swedishpines
plot(X)

Summary statistics of the dataset

summary(X)

## Planar point pattern:  71 points
## Average intensity 0.007395833 points per square unit (one unit = 0.1 
## metres)
## 
## Coordinates are integers
## i.e. rounded to the nearest unit (one unit = 0.1 metres)
## 
## Window: rectangle = [0, 96] x [0, 100] units
## Window area = 9600 square units
## Unit of length: 0.1 metres

Computes the distance from each point to its nearest neighbour in a point pattern.

nearest<-nndist(X)
summary(nearest)

##    Min. 1st Qu.  Median    Mean 3rd Qu.    Max. 
##   2.236   5.541   8.246   7.908  10.050  15.650

Finds the nearest neighbour of each point in a point pattern.

data(cells)
m <- nnwhich(cells)
m2 <- nnwhich(cells, k=2)
#Plot nearest neighbour links
b <- cells[m]
plot(cells)
arrows(cells$x, cells$y, b$x, b$y, angle=15, length=0.15, col="red")


Density plot:

plot(density(swedishpines, 10))


Contour plot of the dataset

contour(density(X,10), axes=FALSE)


How to create point data from an ImageJ particle analysis and Bio7

  1. Open an image dataset (we open the blobs.gif example image from the internet)
  2. Threshold the image
  3. Make a Particle Analysis (Analyze->Analyze Particles…). Select the option ‘Display results’
  4. Transfer the Results table data with the Image-Methods view action ‘Particles’ (ImageJ-Canvas menu: Window->Bio7-Toolbar – Action: Particles)
  5. Execute the R script below

library(spatstat)
imageSizeX<-256
imageSizeY<-254
#Plot is visualized in ImageJ (Java) coordinates!
X<- ppp(Particles$X, Particles$Y, c(0,imageSizeX), c(0,imageSizeY))
plot(x = 1, y = 1,xlim=c(0,imageSizeX),ylim=c(imageSizeY,0), type = "n", main = "blobs.gif", asp = 1, axes = F, xlab = "x", ylab = "y")
plot(X,axes=TRUE,xlim=c(1,imageSizeX),ylim=c(imageSizeY,1),add = T)
axis(1)
axis(2, las = 2)


We can also plot the points as an overlay (Script just for plotting – normally image data for spatstat has to be converted!).

library(spatstat)
imMat<-t(imageMatrix)
im<-as.im(imMat, owin(xrange=c(0,imageSizeX), yrange=c(0,imageSizeY)))
#Plot is visualized in ImageJ (Java) coordinates!
plot(x = 1, y = 1,xlim=c(0,imageSizeX),ylim=c(imageSizeY,0), type = "n", main = "", asp = 1, axes = F, xlab = "x", ylab = "y")
plot.im(im,add=T)
plot(X,xlim=c(0,imageSizeX),ylim=c(imageSizeY,0),add = T)


Video 1: Create a spatstat point pattern from a particle analysis

Video 2: Create a spatstat point pattern from SpatialPoints


Task 1: Create a spatstat object from the image example ‘Cell_Colony.jpg’.

Task 2: Create a density plot from the image ‘Cell_Colony.jpg’.

Task 3: Create a contour plot from the image ‘Cell_Colony.jpg’.


A polygonal window with a point pattern object can also be created with the ‘Image-Methods’ view action ‘Selection’ which opens a view to transfer different type of ImageJ selections as spatial data.

  1. Open the ‘Image-Methods’ view and execute the action ‘Selection’
  2. Open the blobs.gif example and make a polygonal selection
  3. Add the selection to the ROI Manager
  4. Transfer the selection with an enabled ‘Spatial Data’ option as a ‘Spatial Polygons’ – this will create the variable ‘spatialPolygon’ in the R workspace
  5. Convert the SpatialPolygon to a spatstat window object
  6. Threshold the image and execute the ‘Particle’ action in the Image-Methods view
  7. Make a Particle analysis with Bio7 and ImageJ
  8. Plot the particles with the polygonal window

The plot in R coordinates (0,0 in lower left)!

library(maptools)

## Loading required package: sp
## Checking rgeos availability: TRUE

library(spatstat)
polWin<-as(spatialPolygons, "owin")

plot(polWin)


X<- ppp(Particles$X, Particles$Y,window=polWin)
plot(X)


Video: Create a spatstat point pattern with a polygonal window (study region)


Task 1: Create a polygonal point pattern object from the image ‘Cell_Colony.jpeg’.


Marked point patterns

Points in a spatial point pattern may carry additional information called a ‘mark’. A mark can represent additional information like height, diameter, species, etc. It is important to know that marks are not covariates (the points are not a result of the mark values!).

#from the spatstat help:
# marks
m <- sample(1:2, 20, replace=TRUE)
m <- factor(m, levels=1:2)
X <- ppp(x, y, c(0,1), c(0,1), marks=m)

plot(X)


With Bio7 and ImageJ marked point patterns can be created with the ‘Selection’ action which can transfer a SpatialPointDataFrame which again can be converted to a marked point pattern.

  1. Select points and transfer the selections to the ROI Manager
  2. Measure the selections and transfer the ImageJ Results Table to R with the Image-Methods view ‘IJ RT’ action
  3. Transfer the points of the ROI Manager as a SpatialPointsDataFrame (Enable the ‘Add selected data frame’ option and select the dataframe in the combobox)
  4. Convert the SpatialPointsDataFrame to a spatstat point pattern object with the results table as marks

library(maptools)
library(spatstat)
spatialPointsDF<-as(spatialPointsDataFrame, "ppp")

plot(spatialPointsDF)


#print a summary!
summary(spatialPointsDF)

## Marked planar point pattern:  8 points
## Average intensity 0.0002494232 points per square unit
## 
## Coordinates are integers
## i.e. rounded to the nearest unit
## 
## Mark variables: Area, Mean, Min, Max, X, Y
## Summary:
##       Area        Mean          Min           Max            X        
##  Min.   :0   Min.   :160   Min.   :160   Min.   :160   Min.   : 75.0  
##  1st Qu.:0   1st Qu.:190   1st Qu.:190   1st Qu.:190   1st Qu.:124.9  
##  Median :0   Median :220   Median :220   Median :220   Median :198.5  
##  Mean   :0   Mean   :209   Mean   :209   Mean   :209   Mean   :173.1  
##  3rd Qu.:0   3rd Qu.:232   3rd Qu.:232   3rd Qu.:232   3rd Qu.:221.0  
##  Max.   :0   Max.   :248   Max.   :248   Max.   :248   Max.   :233.5  
##        Y         
##  Min.   : 27.50  
##  1st Qu.: 63.25  
##  Median :119.25  
##  Mean   :129.06  
##  3rd Qu.:204.38  
##  Max.   :230.00  
## 
## Window: rectangle = [75, 233] x [27, 230] units
## Window area = 32074 square units

You can also transfer a dataframe from the Table view of Bio7 (rows must be equal to the number of points!) and assign it to the point pattern.


Video: Create a spatstat marked point pattern:


Task 1: Create a marked point pattern from the image ‘Cell_Colony.jpg’.

Task 2: Create a marked point pattern from spreadsheet data in Bio7.


Covariates

Tropical rainforest point pattern dataset bei. We want to find out if trees prefer a steep or flat terrain. The data consists of extra covariate data in ‘bei.extra’, which contains a pixel image of terrain elevation and a pixel image of terrain slope.

data(bei)
slope <- bei.extra$grad
par(mfrow = c(1, 2))

plot(bei)


plot(slope)


Exploratory data analysis

Quadrat count:

data(bei)
Z <- bei.extra$grad
b <- quantile(Z, probs = (0:4)/4)
Zcut <- cut(Z, breaks = b, labels = 1:4)
V <- tess(image = Zcut) 
plot(V)
plot(bei, add = TRUE, pch = "+")


Tesselated:

qb <- quadratcount(bei, tess = V)
plot(qb)


The plot below is an estimate of the intensity p(z) as a function of terrain slope z. It indicates that the Beilschmiedia trees are relatively unlikely to be found on flat terrain (where the slope is less than 0.05) compared to steeper slopes.

plot(rhohat(bei, slope))


Quadrat counting

The study region is divided into rectangles (quadrats) of equal size, and the number of points in each rectangle is counted.

Q <- quadratcount(X, nx = 4, ny = 3)
Q

##                x
## y               [0,0.25] (0.25,0.5] (0.5,0.75] (0.75,1]
##   (0.667,1]            0          2          1        3
##   (0.333,0.667]        2          2          2        1
##   [0,0.333]            0          1          2        4

plot(X)
plot(Q, add = TRUE, cex = 2)


Ripley’s K function

K <- Kest(X)
plot(K)


L function (common linear transformation of K)

  • lines below theoretical line -> over-dispersion
  • lines above theoretical line -> aggregation

L <- Lest(X)
plot(L, main = "L function")


Generate an envelope for the K and L function

ENV <- envelope(Y = swedishpines, fun = Kest, nsim = 40)

## Generating 40 simulations of CSR  ...
## 1, 2, 3, 4, 5, 6, 7, 8, 9, 10, 11, 12, 13, 14, 15,
## 16, 17, 18, 19, 20, 21, 22, 23, 24, 25, 26, 27, 28, 29, 30,
## 31, 32, 33, 34, 35, 36, 37, 38, 39,  40.
## 
## Done.

plot(ENV)


ENVL <- envelope(Y = swedishpines, fun = Lest, nsim = 40)

## Generating 40 simulations of CSR  ...
## 1, 2, 3, 4, 5, 6, 7, 8, 9, 10, 11, 12, 13, 14, 15,
## 16, 17, 18, 19, 20, 21, 22, 23, 24, 25, 26, 27, 28, 29, 30,
## 31, 32, 33, 34, 35, 36, 37, 38, 39,  40.
## 
## Done.

plot(ENVL)


Task 1: Analyze the image example ‘Cell_Colony.jpg’ with the K and the L function.


Miscellaneous


Creation of line patterns

linePattern <- psp(runif(10), runif(10), runif(10), runif(10), window=owin())
plot(linePattern)


Video: Create a spatstat line pattern


Dirichlet Tessellation of point pattern

X <- runifpoint(42)
plot(dirichlet(X))
plot(X, add=TRUE)


Point patterns in 3D

threeDPpp <- pp3(runif(10), runif(10), runif(10), box3(c(0,1)))
plot(threeDPpp)


Video: Create a 3D point pattern from SpatialPoints measurements


Nearest neighbour measurements in 3D

nndist(threeDPpp)

##  [1] 0.3721581 0.1554657 0.2885439 0.1554657 0.5179962 0.6377469 0.1899220
##  [8] 0.2733618 0.1785442 0.1785442

Ripley’s K in 3D

threeDPppKest <- K3est(threeDPpp)
plot(threeDPppKest)


Point pattern example on a Linear Network (e.g. car accidents on a road)

data(simplenet)
Xlin <- rpoislpp(5, simplenet)
plot(Xlin)


Fit a point process model to an observed point pattern.

# fit the stationary Poisson process
# to point pattern 'nztrees'
data(nztrees)
fitted<-ppm(nztrees)
modelFitted<-rmh(fitted)

## Extracting model information...Evaluating trend...done.
## Checking arguments..determining simulation windows...

plot(modelFitted, main="Fitted Model")


References

Used for this script:

(1) A. Baddeley and R. Turner. Spatstat: an R package for analyzing spatial point patterns Journal of Statistical Software 12: 6 (2005) 1-42. www.jstatsoft.org ISSN: 1548-7660

(2) A. Baddeley and R. Turner. Modelling spatial point patterns in R. Chapter 2, pages 23-74 in In Case Studies in Spatial Point Pattern Modelling (eds. A. Baddeley, P. Gregori, J. Mateu, R. Stoica and D. Stoyan) Lecture Notes in Statistics 185. New York: Springer-Verlag 2006. ISBN: 0-387-28311-0

(3) A. Baddeley. Analysing Spatial Point Patterns in R. Workshop Notes, December 2010. Published online by CSIRO, Australia. Download here (232 pages, pdf, 12.2Mb)

To leave a comment for the author, please follow the link and comment on his blog: » R.

R-bloggers.com offers daily e-mail updates about R news and tutorials on topics such as: visualization (ggplot2, Boxplots, maps, animation), programming (RStudio, Sweave, LaTeX, SQL, Eclipse, git, hadoop, Web Scraping) statistics (regression, PCA, time series, trading) and more...

How to perform a Logistic Regression in R

$
0
0

(This article was first published on DataScience+, and kindly contributed to R-bloggers)

Logistic regression is a method for fitting a regression curve, y = f(x), when y is a categorical variable. The typical use of this model is predicting y given a set of predictors x. The predictors can be continuous, categorical or a mix of both.

The categorical variable y, in general, can assume different values. In the simplest case scenario y is binary meaning that it can assume either the value 1 or 0. A classical example used in machine learning is email classification: given a set of attributes for each email such as number of words, links and pictures, the algorithm should decide whether the email is spam (1) or not (0). In this post we call the model “binomial logistic regression”, since the variable to predict is binary, however, logistic regression can also be used to predict a dependent variable which can assume more than 2 values. In this second case we call the model “multinomial logistic regression”. A typical example for instance, would be classifying films between “Entertaining”, “borderline” or “boring”.

Logistic regression implementation in R

R makes it very easy to fit a logistic regression model. The function to be called is glm() and the fitting process is not so different from the one used in linear regression. In this post I am going to fit a binary logistic regression model and explain each step.

The dataset

We’ll be working on the Titanic dataset. There are different versions of this datasets freely available online, however I suggest to use the one available at Kaggle, since it is almost ready to be used (in order to download it you need to sign up to Kaggle).
The dataset (training) is a collection of data about some of the passengers (889 to be precise), and the goal of the competition is to predict the survival (either 1 if the passenger survived or 0 if they did not) based on some features such as the class of service, the sex, the age etc. As you can see, we are going to use both categorical and continuous variables.

The data cleaning process

When working with a real dataset we need to take into account the fact that some data might be missing or corrupted, therefore we need to prepare the dataset for our analysis. As a first step we load the csv data using the read.csv() function.
Make sure that the parameter na.strings is equal to c("") so that each missing value is coded as a NA. This will help us in the next steps.

training.data.raw <- read.csv('train.csv',header=T,na.strings=c(""))

Now we need to check for missing values and look how many unique values there are for each variable using the sapply() function which applies the function passed as argument to each column of the dataframe.

sapply(training.data.raw,function(x) sum(is.na(x)))

PassengerId    Survived      Pclass        Name         Sex 
          0           0           0           0           0 
        Age       SibSp       Parch      Ticket        Fare 
        177           0           0           0           0 
      Cabin    Embarked 
        687           2 

sapply(training.data.raw, function(x) length(unique(x)))

PassengerId    Survived      Pclass        Name         Sex 
        891           2           3         891           2 
        Age       SibSp       Parch      Ticket        Fare 
         89           7           7         681         248 
      Cabin    Embarked 
        148           4

A visual take on the missing values might be helpful: the Amelia package has a special plotting function missmap() that will plot your dataset and highlight missing values:

library(Amelia)
missmap(training.data.raw, main = "Missing values vs observed")

Rplot
The variable cabin has too many missing values, we will not use it. We will also drop PassengerId since it is only an index and Ticket.
Using the subset() function we subset the original dataset selecting the relevant columns only.

data <- subset(training.data.raw,select=c(2,3,5,6,7,8,10,12))

Taking care of the missing values

Now we need to account for the other missing values. R can easily deal with them when fitting a generalized linear model by setting a parameter inside the fitting function. However, personally I prefer to replace the NAs “by hand”, when is possible. There are different ways to do this, a typical approach is to replace the missing values with the average, the median or the mode of the existing one. I’ll be using the average.

data$Age[is.na(data$Age)] <- mean(data$Age,na.rm=T)

As far as categorical variables are concerned, using the read.table() or read.csv() by default will encode the categorical variables as factors. A factor is how R deals categorical variables.
We can check the encoding using the following lines of code

is.factor(data$Sex)
TRUE

is.factor(data$Embarked)
TRUE

For a better understanding of how R is going to deal with the categorical variables, we can use the contrasts() function. This function will show us how the variables have been dummyfied by R and how to interpret them in a model.

contrasts(data$Sex)
       male
female    0
male      1

contrasts(data$Embarked)
  Q S
C 0 0
Q 1 0
S 0 1

For instance, you can see that in the variable sex, female will be used as the reference. As for the missing values in Embarked, since there are only two, we will discard those two rows (we could also have replaced the missing values with the mode and keep the datapoints).

data <- data[!is.na(data$Embarked),]
rownames(data) <- NULL

Before proceeding to the fitting process, let me remind you how important is cleaning and formatting of the data. This preprocessing step often is crucial for obtaining a good fit of the model and better predictive ability.

Model fitting

We split the data into two chunks: training and testing set. The training set will be used to fit our model which we will be testing over the testing set.

train <- data[1:800,]
test <- data[801:889,]

Now, let’s fit the model. Be sure to specify the parameter family=binomial in the glm() function.

model <- glm(Survived ~.,family=binomial(link='logit'),data=train)

By using function summary() we obtain the results of our model:

summary(model)

Call:
glm(formula = Survived ~ ., family = binomial(link = "logit"), 
    data = train)

Deviance Residuals: 
    Min       1Q   Median       3Q      Max  
-2.6064  -0.5954  -0.4254   0.6220   2.4165  

Coefficients:
             Estimate Std. Error z value Pr(>|z|)    
(Intercept)  5.137627   0.594998   8.635  < 2e-16 ***
Pclass      -1.087156   0.151168  -7.192 6.40e-13 ***
Sexmale     -2.756819   0.212026 -13.002  < 2e-16 ***
Age         -0.037267   0.008195  -4.547 5.43e-06 ***
SibSp       -0.292920   0.114642  -2.555   0.0106 *  
Parch       -0.116576   0.128127  -0.910   0.3629    
Fare         0.001528   0.002353   0.649   0.5160    
EmbarkedQ   -0.002656   0.400882  -0.007   0.9947    
EmbarkedS   -0.318786   0.252960  -1.260   0.2076    
---
Signif. codes:  0 ‘***’ 0.001 ‘**’ 0.01 ‘*’ 0.05 ‘.’ 0.1 ‘ ’ 1

(Dispersion parameter for binomial family taken to be 1)

    Null deviance: 1065.39  on 799  degrees of freedom
Residual deviance:  709.39  on 791  degrees of freedom
AIC: 727.39

Number of Fisher Scoring iterations: 5

Interpreting the results of our logistic regression model

Now we can analyze the fitting and interpret what the model is telling us.
First of all, we can see that SibSp, Fare and Embarked are not statistically significant. As for the statistically significant variables, sex has the lowest p-value suggesting a strong association of the sex of the passenger with the probability of having survived. The negative coefficient for this predictor suggests that all other variables being equal, the male passenger is less likely to have survived. Remember that in the logit model the response variable is log odds: ln(odds) = ln(p/(1-p)) = a*x1 + b*x2 + … + z*xn. Since male is a dummy variable, being male reduces the log odds by 2.75 while a unit increase in age reduces the log odds by 0.037.

Now we can run the anova() function on the model to analyze the table of deviance

anova(model, test="Chisq")

Analysis of Deviance Table
Model: binomial, link: logit
Response: Survived
Terms added sequentially (first to last)

         Df Deviance Resid. Df Resid. Dev  Pr(>Chi)    
NULL                       799    1065.39              
Pclass    1   83.607       798     981.79 < 2.2e-16 ***
Sex       1  240.014       797     741.77 < 2.2e-16 ***
Age       1   17.495       796     724.28 2.881e-05 ***
SibSp     1   10.842       795     713.43  0.000992 ***
Parch     1    0.863       794     712.57  0.352873    
Fare      1    0.994       793     711.58  0.318717    
Embarked  2    2.187       791     709.39  0.334990    
---
Signif. codes:  0 ‘***’ 0.001 ‘**’ 0.01 ‘*’ 0.05 ‘.’ 0.1 ‘ ’ 1

The difference between the null deviance and the residual deviance shows how our model is doing against the null model (a model with only the intercept). The wider this gap, the better. Analyzing the table we can see the drop in deviance when adding each variable one at a time. Again, adding Pclass, Sex and Age significantly reduces the residual deviance. The other variables seem to improve the model less even though SibSp has a low p-value. A large p-value here indicates that the model without the variable explains more or less the same amount of variation. Ultimately what you would like to see is a significant drop in deviance and the AIC.

While no exact equivalent to the R2 of linear regression exists, the McFadden R2 index can be used to assess the model fit.

library(pscl)
pR2(model)

         llh      llhNull           G2     McFadden         r2ML         r2CU 
-354.6950111 -532.6961008  356.0021794    0.3341513    0.3591775    0.4880244

Assessing the predictive ability of the model

In the steps above, we briefly evaluated the fitting of the model, now we would like to see how the model is doing when predicting y on a new set of data. By setting the parameter type='response', R will output probabilities in the form of P(y=1|X). Our decision boundary will be 0.5. If P(y=1|X) > 0.5 then y = 1 otherwise y=0. Note that for some applications different thresholds could be a better option.

fitted.results <- predict(model,newdata=subset(test,select=c(2,3,4,5,6,7,8)),type='response')
fitted.results <- ifelse(fitted.results > 0.5,1,0)

misClasificError <- mean(fitted.results != test$Survived)
print(paste('Accuracy',1-misClasificError))

"Accuracy 0.842696629213483"

The 0.84 accuracy on the test set is quite a good result. However, keep in mind that this result is somewhat dependent on the manual split of the data that I made earlier, therefore if you wish for a more precise score, you would be better off running some kind of cross validation such as k-fold cross validation.

As a last step, we are going to plot the ROC curve and calculate the AUC (area under the curve) which are typical performance measurements for a binary classifier.
The ROC is a curve generated by plotting the true positive rate (TPR) against the false positive rate (FPR) at various threshold settings while the AUC is the area under the ROC curve. As a rule of thumb, a model with good predictive ability should have an AUC closer to 1 (1 is ideal) than to 0.5.

library(ROCR)
p <- predict(model, newdata=subset(test,select=c(2,3,4,5,6,7,8)), type="response")
pr <- prediction(p, test$Survived)
prf <- performance(pr, measure = "tpr", x.measure = "fpr")
plot(prf)

auc <- performance(pr, measure = "auc")
auc <- auc@y.values[[1]]
auc

0.8647186

And here is the ROC plot:
Rplot01

I hope this post will be useful. A gist with the full code for this example can be found here.

Thank you for reading this post, leave a comment below if you have any question.

To leave a comment for the author, please follow the link and comment on his blog: DataScience+.

R-bloggers.com offers daily e-mail updates about R news and tutorials on topics such as: visualization (ggplot2, Boxplots, maps, animation), programming (RStudio, Sweave, LaTeX, SQL, Eclipse, git, hadoop, Web Scraping) statistics (regression, PCA, time series, trading) and more...
Viewing all 321 articles
Browse latest View live