Quantcast
Channel: Search Results for “how to import image file to r”– R-bloggers
Viewing all 321 articles
Browse latest View live

KDD Cup 2015: The story of how I built hundreds of predictive models….And got so close, yet so far away from 1st place!

$
0
0

(This article was first published on Data Until I Die!, and kindly contributed to R-bloggers)

The challenge from the KDD Cup this year was to use their data relating to student enrollment in online MOOCs to predict who would drop out vs who would stay.

The short story is that using H2O and a lot of my free time, I trained several hundred GBM models looking for the final one which eventually got me an AUC score of 0.88127 on the KDD Cup leaderboard and at the time of this writing landed me in 120th place. My score is 2.6% away from 1st place, but there are 119 people above me!

Here are the main characters of this story:

mariadb
MySQL Workbench
R
H2O

It started with my obsessive drive to find an analytics project to work on. I happened upon the KDD Cup 2015 competition and decided to give it a go. It had the characteristics of a project that I wanted to get into:

1) I could use it to practice my SQL skills
2) The data set was of a moderate size (training table was 120,542 records, log info table was 8,151,053 records!)
3) It looked like it would require some feature engineering
4) I like predictive modeling competitions :)

Once I had loaded up the data into a mariadb database, I had to come to decisions about how I would use the info in each table. Following were my thought processes for each table:

enrollment_train / enrollment_test
Columns: enrollment_id, username, course_id

Simply put, from this table I extracted the number of courses each student (username) was enrolled in, and also the number of students enrolled in each course (course_id).

log_train / log_test
Columns: enrollment_id, tstamp, source, logged_event, object

There were a few items of information that I decided to extract from this table:

1) Number of times each particular event was logged for every enrollment_id
2) Average timestamp for each event for each enrollment_id
3) Min and Max timestamp for each event for each enrollment_id
4) Total time elapsed from the first to the last instance of each event for each enrollment_id
5) Overall average timestamp for each enrollment_id

Contrary to what you might think, the object field does not seem to link up with the object table.

object
Columns: course_id, module_id, category, children, tstart

From this table I extracted a count of course components by course_id and also the number of ‘children’ per course_id. I assume these are relational references but am not sure what in the data set these child IDs refer to.

truth_train
Columns: enrollment_id, dropped_out

I didn’t extract anything special out of this table, but used it as the table to which all other SQL views that I had created were linked.

If you’d like to see the SQL code I used to prepare the tables, views, and the final output table I used to train the model, see my github repo for this project.

Import into R and Feature Engineering

Once I imported the data into R through RODBC, you’ll see in the code that my feature engineering was essentially a desperate fishing expedition where I tried a whole lot of stuff.  I didn’t even end up using everything that I had engineered through my R code, but as my final model included 35 variables, I wasn’t suffering any severe lack! If you download the KDD Cup 2015 data and are having a look around, feel free to let me know if I’ve missed any important variables!

H2O, Model Tuning, and Training of The Final Model

This is the part where I managed to train hundreds of models! I don’t think this would have been feasible just using plain R on my computer alone (I have 8GB of RAM and an 8 core AMD processor). For these tasks I turned to H2O. For those who don’t know, H2O is a java based analytical interface for cloud computing that is frankly very easy and beneficial to set up when all you have at your disposal is one computer. I say beneficial for one reason: my computer chokes when trying to train ensemble models on even moderate sized data sets. Through H2O, I’m able to get it done without watching the RAM meter on my system monitor shoot all the way up to full capacity!! What you’ll notice in my R code is that R is able to interface with H2O in such a way that once I passed the dataframe with the training data to H2O, it was H2O that handled the modeling from there, and sends info back to R when available or requested (e.g. while you’re training a model, it gives you a cute text-based progress bar automatically!). More on this soon.

Before I show some results, I want to talk about my model tuning algorithm. Let’s look at the relevant code, then I’ll break it down verbally.

ntree = seq(100,500,100)
balance_class = c(TRUE,FALSE)
learn_rate = seq(.05,.4,.05)

parameters = list(ntree = c(), balance_class = c(), learn_rate = c(), r2 = c(), min.r2 = c(), max.r2 = c(), acc = c(), min.acc = c(), max.acc = c(), AUC = c(), min.AUC = c(), max.AUC = c())
n = 1

mooc.hex = as.h2o(localH2O, mooc[,c("enrollment_id","dropped_out_factor",x.names)])
for (trees in ntree) {
  for (c in balance_class) {
    for (rate in learn_rate) {
      r2.temp = c(NA,NA,NA)
      acc.temp = c(NA,NA,NA)
      auc.temp = c(NA,NA,NA)
      for (i in 1:3) {
        
        mooc.hex.split = h2o.splitFrame(mooc.hex, ratios=.8)   
        train.gbm = h2o.gbm(x = x.names, y = "dropped_out_factor",  training_frame = mooc.hex.split[[1]],
                            validation_frame = mooc.hex.split[[2]], ntrees = trees, balance_classes = c, learn_rate = rate)
        r2.temp[i] = train.gbm@model$validation_metrics@metrics$r2
        acc.temp[i] = train.gbm@model$validation_metrics@metrics$max_criteria_and_metric_scores[4,3]
        auc.temp[i] = train.gbm@model$validation_metrics@metrics$AUC
      }
    parameters$ntree[n] = trees
    parameters$balance_class[n] = c
    parameters$learn_rate[n] = rate
    parameters$r2[n] = mean(r2.temp)
    parameters$min.r2[n] = min(r2.temp)
    parameters$max.r2[n] = max(r2.temp)
    parameters$acc[n] = mean(acc.temp)
    parameters$min.acc[n] = min(acc.temp)
    parameters$max.acc[n] = max(acc.temp)
    parameters$AUC[n] = mean(auc.temp)
    parameters$min.AUC[n] = min(auc.temp)
    parameters$max.AUC[n] = max(auc.temp)
    n = n+1
    }
  }
}


parameters.df = data.frame(parameters)
parameters.df[which.max(parameters.df$AUC),]

The model that I decided to use is my usual favourite, gradient boosting machines (h2o.gbm is the function you use to train a gbm model through H2O). As such, the 3 hyperparameters which I chose to vary and evaluate in the model tuning process were number of trees, whether or not to balance the outcome classes through over/undersampling, and the learning rate. As you can see above, I wanted to try out numerous values for each hyperparameter, making 5 values for number of trees, 2 values for balance classes, and 8 values for learning rate, totalling 80 possible combinations of all 3 hyperparameter values together. Furthermore, I wanted to try out each combination of hyperparemeter values on 3 random samples of the training data. So, 3 samples of each one of 80 combinations is equal to 240 models trained and validated with the aim of selecting the one with the best area under the curve (AUC). As you can see, each time I trained a model, I saved and summarised the validation stats in a growing list which I ultimately converted to a data.frame and called called parameters.df

The best hyperparameters, according to these validation stats which I collected, are:

– ntree = 500
– balance_class = FALSE
– learn_rate = .05

You can see a very nice summary of how validation set performance changed depending on the values of all of these parameters in the image below (the FALSE and TRUE over the two facets refer to the balance_class values.

AUC by Tuning Parameters

Have a look at my validation data model summary output from the H2O package below:

H2OBinomialMetrics: gbm
** Reported on validation data. **

MSE:  0.06046745
R^2:  0.102748
LogLoss:  0.2263847
AUC:  0.7542866
Gini:  0.5085732

Confusion Matrix for F1-optimal threshold:
            dropped out stayed    Error         Rate
dropped out       21051   1306 0.058416  =1306/22357
stayed             1176    576 0.671233   =1176/1752
Totals            22227   1882 0.102949  =2482/24109

Maximum Metrics:
                      metric threshold    value        idx
1                     max f1  0.170555 0.317006 198.000000
2                     max f2  0.079938 0.399238 282.000000
3               max f0point5  0.302693 0.343008 134.000000
4               max accuracy  0.612984 0.929321  48.000000
5              max precision  0.982246 1.000000   0.000000
6           max absolute_MCC  0.170555 0.261609 198.000000
7 max min_per_class_accuracy  0.061056 0.683410 308.000000

The first statistic that my eyes were drawn to when I saw this output was the R^2 statistic. It looks quite low and I’m not even sure why. That being said, status in the KDD Cup 2015 competition is measured in AUC, and here you can see that it is .75 on my validation data. Next, have a look at the confusion matrix. You can see in the Error column that the model did quite well predicting who would drop out (naturally, in my opinion), but did not do so well figuring out who would stay. The overall error rate on the validation data is 10%, but I’m still not so happy about the high error rate as it pertains to those who stayed in the MOOC.

So this was all well and good (and was what got me my highest score yet according to the KDD Cup leaderboard) but what if I could get better performance with fewer variables? I took a look at my variable importances and decided to see what would happen if I eliminate the variables with the lowest importance scores one by one until I reach the variable with the 16th lowest importance score. Here’s the code I used:

varimps = data.frame(h2o.varimp(train.gbm))
variable.set = list(nvars = c(), AUC = c(), min.AUC = c(), max.AUC = c())

mooc.hex = as.h2o(localH2O, mooc[,c("enrollment_id","dropped_out_factor",x.names)])
n = 1
for (i in seq(35,20)) {
  auc.temp = c(NA,NA,NA)
  x.names.new = setdiff(x.names, varimps$variable[i:dim(varimps)[1]])
  for (j in 1:3) {
        mooc.hex.split = h2o.splitFrame(mooc.hex, ratios=.8)  
        train.gbm.smaller = h2o.gbm(x = x.names.new, y = "dropped_out_factor",  training_frame = mooc.hex.split[[1]],
                            validation_frame = mooc.hex.split[[2]], ntrees = 500, balance_classes = FALSE, learn_rate = .05)
        auc.temp[j] = train.gbm.smaller@model$validation_metrics@metrics$AUC
        }
    variable.set$AUC[n] = mean(auc.temp)
    variable.set$min.AUC[n] = min(auc.temp)
    variable.set$max.AUC[n] = max(auc.temp)
    variable.set$nvars[n] = i-1
    n = n + 1
}

variable.set.df = data.frame(variable.set)

You can see that it’s a similar algorithm as what I used to do the model tuning. I moved up the variable importance list from the bottom, one variable at a time, and progressively eliminated more variables. I trained 3 models for each new number of variables, each on a random sample of the data, and averaged the AUCs from those models (totalling 48 models). See the following graph for the result:

AUC by num vars

As you can see, even though the variables I eliminated were of the lowest importance, they were still contributing something positive to the model. This goes to show how well GBM performs with variables that could be noisy.

Now let’s look at the more important variables according to H2O:

                           variable relative_importance scaled_importance   percentage
1                 num_logged_events        48481.160156      1.000000e+00 5.552562e-01
2     DAYS_problem_total_etime_unix        11651.416992      2.403288e-01 1.334440e-01
3                      days.in.mooc         6495.756348      1.339852e-01 7.439610e-02
4      DAYS_access_total_etime_unix         3499.054443      7.217349e-02 4.007478e-02
5                         avg_month         3019.399414      6.227985e-02 3.458127e-02
6                           avg_day         1862.299316      3.841285e-02 2.132897e-02
7                    Pct_sequential         1441.578247      2.973481e-02 1.651044e-02
8    DAYS_navigate_total_etime_unix          969.427734      1.999597e-02 1.110289e-02
9                       num_courses          906.499451      1.869797e-02 1.038217e-02
10                      Pct_problem          858.774353      1.771357e-02 9.835569e-03
11                     num_students          615.350403      1.269257e-02 7.047627e-03

Firstly, we see that the number of logged events was the most important variable for predicting drop-out. I guess the more active they are, the less likely they are to drop out. Let’s see a graph:

MOOC dropout by num logged events

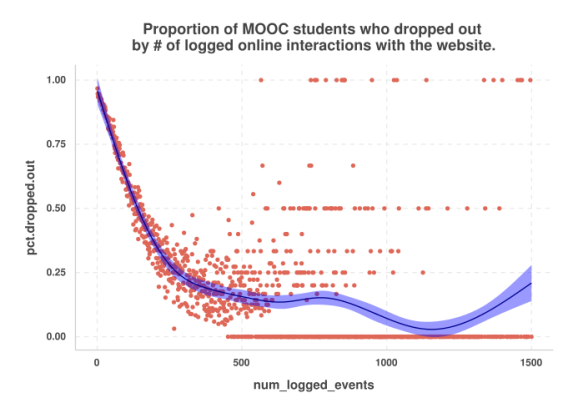
Although a little bit messy because I did not bin the num_logged_events variable, we see that this is exactly the case that those students who were more active online were less likely to drop out.

Next, we see a few variables regarding the days spent doing something. They seem to follow similar patterns, so the image I’ll show you below involves the days.in.mooc variable. This is simply how many days passed from the logging of the first event to the last.

MOOC dropouts by days in mooc

Here we see a very steady decrease in probability of dropping out where those who spent very little time from their first to their last interaction with the MOOC are the most likely to drop out, whereas those who spend more time with it are obviously less likely.

Next, let’s look at the avg_month and avg_day variables. These were calculated by taking the average timestamp of all events for each person enrolled in each course and then extracting the month and then the day from that timestamp. Essentially, when, on average, did they tend to do that course.

MOOC dropout by avg month and day

Interestingly, most months seem to exhibit a downward pattern, whereby if the person tended to have their interactions with the MOOC near the end of the month, then they were less likely to drop out, but if they had their interactions near the beginning they were more likely to drop out. This applied to February, May, June, November, and December. The reverse seems to be true for July and maybe October. January maybe applies to the second list.

The last two plots I’ll show you relate to num_courses and num_students, in other words, how many courses each student is taking and how many students are in each course.

MOOC dropouts by # courses per student

MOOC dropout by course popularity

The interesting result here is that it’s only those students who were super committed (taking more than 20 courses in the period captured by the data) who appeared significantly less likely to drop out than those who were taking fewer courses.

Finally, you can see that as the number of students enrolled in a course went up, the overall drop-out rate decreased. Popular courses retain students!

Conclusion

This was fun! I was amazed by how obsessed I became on account of this competition. I’m disappointed that I couldn’t think of something to bridge the 2.6% gap between me and first place, but the point of this was to practice, to learn something new, and have fun. I hope you enjoyed it too!

To leave a comment for the author, please follow the link and comment on his blog: Data Until I Die!.

R-bloggers.com offers daily e-mail updates about R news and tutorials on topics such as: visualization (ggplot2, Boxplots, maps, animation), programming (RStudio, Sweave, LaTeX, SQL, Eclipse, git, hadoop, Web Scraping) statistics (regression, PCA, time series, trading) and more...

The Workflow of Infinite Shame, and other stories from the R Summit

$
0
0

(This article was first published on 4D Pie Charts » R, and kindly contributed to R-bloggers)

At day one of the R Summit at Copenhagen Business School there was a lot of talk about the performance of R, and alternate R interpreters.

Luke Tierney of the University of Iowa, the author of the compiler package, and R-Core member who has been working on R’s performance since, well, pretty much since R was created, talked about future improvements to R’s internals.

Plans to improve R’s performance include implementing proper reference counting (that is tracking how many variables point at a particular bit of memory; the current version counts like zero/one/two-or-more, and a more accurate count means you can do less copying). Improving scalar performance and reducing function overhead are high priorities for performance enhancement. Currently when you do something like

for(i in 1:100000000) {}

R will assign a vector of length 100000000, which takes a ridiculous amount of memory. By being smart and realising that you only ever need one number at a time, you can store the vector much more efficiently. The same principle applies for seq_len and seq_along.

Other possible performance improvements that Luke discussed include having a more efficient data structure for environments, and storing the results of complex objects like model results more efficiently. (How often do you use that qr element in an lm model anyway?

Tomas Kalibera of Northeastern University has been working on a tool for finding PROTECT bugs in the R internals code. I last spoke to Tomas in 2013 when he was working with Jan Vitek on the alternate R engine, FastR. See Fearsome Engines part 1, part 2, part 3. Since then FastR has become a purely Oracle project (more on that in a moment), and the Purdue University fork of FastR has been retired.

The exact details of the PROTECT macro went a little over my head, but the essence is that it is used to stop memory being overwritten, and it’s a huge source of obscure bugs in R.

Lukas Stadler of Oracle Labs is the heir to the FastR throne. The Oracle Labs team have rebuilt it on top of Truffle, an Oracle product for generating dynamically optimized Java bytecode that can then be run on the JVM. Truffle’s big trick is that it can auto-generate this byte code for a variety of languages: R, Ruby and JavaScript are the officially supported languages, with C, Python and SmallTalk as side-projects. Lukas claimed that peak performance (that is, “on a good day”) for Truffle-generated code is comparable to language-specific optimized code.

Non-vectorised code is the main beneficiary of the speedup. He had a cool demo where a loopy version of the sum function ran slowly, then Truffle learned how to optimise it, and the result became almost as fast as the built-in sum function.

He has a complaint that the R.h API from R to C is really and API from GNU R to C, that is, it makes too many assumptions about how GNU works, and these don’t hold true when you are running a Java version of R.

Maarten-Jan Kallen from BeDataDriven works on Renjin, the other R interpreter built on top of the JVM. Based on his talk, and some other discussion with Maarten, it seems that there is a very clear mission-statement for Renjin: BeDataDriven just want a version of R that runs really fast inside Google App Engine. They also count an interesting use case forRenjin – it is currently powering software for the United Nations’ humanitarian effort in Syria.

Back to the technical details, Maarten showed an example where R 3.0.0 introduced the anyNA function as a fast version of any(is.na(x)). In the case of Renjin, this isn’t necessary since it works quickly anyway. (Though if Luke Tierney’s talk come true, it won’t be needed in GNU R soon either.)

Calling external code still remains a problem for Renjin; in particular Rcpp and it’s reverse dependencies won’t build for it. The spread of Rcpp, he lamented, even includes roxygen2.

Hannes Mühleisen has also been working with BeDataDriven, and completed Maarten’s talk. He previously worked on integrating MonetDB with R, and has been applying his database expertise to Renjin. In the same way that when you run a query in a database, it generates a query plan to try and find the most efficient way of retrieving your results, Renjin now generates a query plan to find the most efficient way to evaluate your code. That means using a deferred execution system where you avoid calculating things until the last minute, and in some cases not at all because another calculation makes them obsolete.

Karl Millar from Google has been working on CXXR. This was a bit of a shock to me. When I interviewed Andrew Runnalls in 2013, he didn’t really sell CXXR to me particularly well. The project goals at the time were to clean up the GNU R code base, rewriting it in modern C++, and documenting it properly to use as a reference implementation of R. It all seemed a bit of academic fun rather than anything useful. Since Google has started working on the project, the focus has changed. It is now all about having a high performance version of R.

I asked Andrew why he choose CXXR for this purpose. After all, of the half a dozen alternate R engines, CXXR was the only one that didn’t explicitly have performance as a goal. His response was that it has nearly 100% code compatibility with GNU R, and that the code is so clear that it makes it easy to make changes.

That talk focussed on some of the difficulties of optimizing R code. For example, in the assignment

a <- b + c

you don’t know how long b and c are, or what their classes are, so you have to spend a long time looking things up. At runtime however, you can guess a bit better. b and c are probably the same size and class as what you used last time, so guess that first.

He also had a little dig at Tomas Kalibera’s work, saying that CXXR has managed to eliminate almost all the PROTECT macros in its codebase.

Radford Neal talked about some optimizations in his pqR project, which uses both interpreted and byte-compiled code.

In interpreted code, pqR uses a “variant result” mechanism, which sounded similar to Renjin’s “deferred execution”.

A performance boost comes from having a fast interface to unary primitives. This also makes eval faster. Another boost comes fro ma smarter way to not look for variables in certain frames. For example, a list of which frames contain overrides for special symbols (+, [, if, etc.) is maintained, so calling them is faster.

Matt Dowle (“the data.table guy”) of H2O gave a nice demo of H2O Flow, a slick web-based GUI for machine learning on big datasets. It does lots of things in parallel, and is scriptable.

Indrajit Roy of HP Labs and Michael Lawrence of Genentech gave a talk on distributed data structures. These seem very good for cases where you need to access your data from multiple machines.

The SparkR package gives access to distributed data structures with a Spark backend, however Indrajit wasn’t keen, saying that it is too low-level to be easy to work with.

Instead he and Michael have developed the dds package that gives a standard interface for using distributed data structures. The package lies on top of Spark.dds and distributedR.dds. The analogy is with DBI providing a stanrdard database interface that uses RSQLite or RPostgreSQL underneath.

Ryan Hafen of Tessera talked about their product (I think also called Tessara) for analysing large datasets. It’s a fancy wrapper to MapReduce that also has distributed data objects. I didn’t get chance to ask if they support the dds interface. The R packages of interest are datadr and trelliscope.

My own talk was less technical than the others today. It consisted of a series of rants about things I don’t like about R, and how to fix them. The topics included how to remove quirks from the R language (please deprecate indexing with factors), helping new users (let the R community create some vignettes to go in base-R), and how to improve CRAN (CRAN is not a code hosting service, CRAN is a shop for packages). I don’t know if any of my suggestions will be taken up, but my last slide seemed to generate some empathy.

I’ve named my CRAN submission process “The Workflow of Infinite Shame”. What tends to happen is that I check that things work on my machine, submit to CRAN, and about an hour later get a response saying “we see these errors, please fix”. Quite often, especially for things involving locales or writing files, I cannot reproduce the issue, so I fiddle about a bit and guess, then resubmit. After five or six iterations, I’ve lost all sense of dignity, and while R-core are very patient, I’m sure they assume that I’m an idiot.

CRAN currently includes a Win-builder service that lets you submit packages, builds them under Windows, then tells you the results. What I want is an everything-builder service that builds and checks my package on all the necessary platforms (Windows, OS X, Linux, BSD, Solaris on R-release, R-patched, and R-devel), and only if it passes does a member of R-core get to see the problem. That way, R-core’s time isn’t wasted, and more importantly I look like less of an idiot.

A flow diagram of CRAN submission steps with an infinite loop

The workflow of infinite shame encapsulates my CRAN submission process.

Tagged: r, r-summit

To leave a comment for the author, please follow the link and comment on his blog: 4D Pie Charts » R.

R-bloggers.com offers daily e-mail updates about R news and tutorials on topics such as: visualization (ggplot2, Boxplots, maps, animation), programming (RStudio, Sweave, LaTeX, SQL, Eclipse, git, hadoop, Web Scraping) statistics (regression, PCA, time series, trading) and more...

DotCity: a game written in R? and other statistical computer games?

$
0
0

(This article was first published on Civil Statistician » R, and kindly contributed to R-bloggers)

A while back I recommended Nathan Uyttendaele’s beginner’s guide to speeding up R code.

I’ve just heard about Nathan’s computer game project, DotCity. It sounds like a statistician’s minimalist take on SimCity, with a special focus on demographic shifts in your population of dots (baby booms, aging, etc.). Furthermore, he’s planning to program the internals using R.

This is where scatterplot points go to live and play when they're not on duty.

This is where scatterplot points go to live and play when they’re not on duty.

Consider backing the game on Kickstarter (through July 8th). I’m supporting it not just to play the game itself, but to see what Nathan learns from the development process. How do you even begin to write a game in R? Will gamers need to have R installed locally to play it, or will it be running online on something like an RStudio server?

Meanwhile, do you know of any other statistics-themed computer games?

  • I missed the boat on backing Timmy’s Journey, but happily it seems that development is going ahead.
  • SpaceChem is a puzzle game about factory line optimization (and not, actually, about chemistry). Perhaps someone can imagine how to take it a step further and gamify statistical process control à la Shewhart and Deming.
  • It’s not exactly stats, but working with data in textfiles is an important related skill. The Command Line Murders is a detective noir game for teaching this skill to journalists.
  • The command line approach reminds me of Zork and other old text adventure / interactive fiction games. Perhaps, using a similar approach to the step-by-step interaction of swirl (“Learn R, in R”), someone could make an I.F. game about data analysis. Instead of OPEN DOOR, ASK TROLL ABOUT SWORD, TAKE AMULET, you would type commands like READ TABLE, ASK SCIENTIST ABOUT DATA DICTIONARY, PLOT RESIDUALS… all in the service of some broader story/puzzle context, not just an analysis by itself.
  • Kim Asendorf wrote a fictional “short story” told through a series of data visualizations. (See also FlowingData’s overview.) The same medium could be used for a puzzle/mystery/adventure game.

To leave a comment for the author, please follow the link and comment on his blog: Civil Statistician » R.

R-bloggers.com offers daily e-mail updates about R news and tutorials on topics such as: visualization (ggplot2, Boxplots, maps, animation), programming (RStudio, Sweave, LaTeX, SQL, Eclipse, git, hadoop, Web Scraping) statistics (regression, PCA, time series, trading) and more...

From cats to zombies, Wednesday at useR2015

$
0
0

(This article was first published on 4D Pie Charts » R, and kindly contributed to R-bloggers)

The morning opened with someone who I was too bleary eyed to work out who it was. Possibly the dean of the University of Aalborg. Anyway, he said that this is the largest ever useR conference, and the first ever in a Nordic country. Take that, Norway! Also, considering that there are now quite a few R-based conferences (Bioconductor has its own conference, not to mention R in Finance and EARL), it’s impressive that these haven’t taken away from the main event.

Torben the conference organiser then spoke briefly and mentioned that planning for this event started back in June 2013.

Keynote

Romain Francois gave a talk of equal parts making-R-go-faster, making-R-syntax-easier, and cat-pix. He quipped that he has an open relationship with R: he gets to use Java and C++, and “I’m fine with other people using R”. Jokes aside, he gave an overview of his big R achievements: the new and J functions for rJava that massively simplified that calling syntax; the //[[Rcpp::export]] command that massively simplified writing Rcpp code, and the internals to the dplyr package.

He also gave a demo of JJ Allaire’s RcppParallel, and talked about plans to intgrate that into dplyr for a free performance boost on multicore systems.

I also had a coffee-break chat with mathematician Luzia Burger-Ringer (awesome name), who has recently started R programming after a seventeen year career break to raise children. She said:

“When I returned to work I struggled to remember my mathematics training, but using R I could be productive. Compared to Fortran it’s just a few lines of code to get an answer.”

Considering that I’ve forgotten pretty much everything I know by the time I’ve returned from vacation, I’m impressed that by Lucia’s ability to dive in after a 17 year break. And I think this is good counter-evidence of R’s perceived tricky learning curve. Try fitting a random forest model in Fortran!

After being suitably caffeinated, I went to the interfacing session discussing connecting R to other languages.

Interfacing

Kasper Hansen had some lessons for integrating external libraries into R packages. He suggested two approaches:

“Either you link to the library, maybe with a function to download that library – this is easiest for the developer; or you include the library in your package – this is easiest for the user”.

He said he’s mostly gone for the latter approach, but said that cross-platform development in this way is mostly a bit of a nightmare.

Kasper gave examples of the illuminaio package, for reading some biological files with no defined specification, some versions of which were encrypted; the affxparser package for reading Affymetrix RNA sequence files, which didn’t have proper OS-independent file paths, and RGraphviz which connects to the apparently awfully implemented Graphviz network visualization software. There were many tales of death-by-memory-leak.

In the discussion afterwards it was interesting to note the exchange between Kasper and Dirk Eddelbuettel. Dirk suggested that Kasper was overly negative about the problems of interfacing with external libraries because he’d had the unfortunate luck to deal with many bad-but-important ones, whereas in general you can just pick good libraries to work with.

My opinion is that Kasper had to pick libraries built by biologists, and my experience is that biologists are generally better at biology than software development (to put it politely).

Christophe Best talked about calling R from Go. After creating the language, Google seem to be making good internal use of Go. And as a large organisation, they suffer from the -different-people-writing-different-languages problem quite acutely. Consequently, they have a need for R to plug modelling gaps in their fledgeling systems language.

Their R-Go connector runs R in a different process to Go (unlike Rcpp, which uses an intra-process sytem, according to Christophe). This is more complex to set-up, but means that “R and Go don’t have shared crashes”.

It sounds promising, but for the moment, you can only pass atomic types and list. Support for data frames is planned, as is support for calling Go from R, so this is a project to watch.

Matt Ziubinski talked about libraries to help you work with Rcpp. He recommended Catch, a testing framework C++. The code for this looked pretty readably (even to me, who hasn’t really touched C++ in over a decade).

He also recommended Boost, which allows compile-time calculations, easy parallel processing, and pipes.

He was also a big fan of C++11, which simplifies a lot of boilerplate coding.

Dan Putler talked about connecting to Sparks Mlib packge for machine learning. He said that connecting to the library was easy, but then they wondered why they had bothered! Always fun to see some software being flamed.

Apparently the regression tools in Spark Mlib don’t hold a candle to R’s lm and glm. They may not be fancy functions, but they’ve been carefully built for robustness.

After some soul-searching, Dan decided that Spark was still worth using, despite the weakness of Mlib, since it nicely handles distributing your data.

He and his team have created a SparkGLM package that ports R’s linear regression algorithms to Spark. lm is mostly done; glm is work-in-progress.

After lunch, I went to the clustering session.

Clustering

Anders Bilgram kicked off the afternoon session with a talk on unsupervised meta-analysis using Gaussian mixed copula models. Say that ten times fast.

He described this a a semi-parametric version of the more standard Gaussian mixed models. I think he meant this as in “mixture models” where you consider your data to be consist of things from several different distributions, rather than mixed effects models where you have random effects.

The Gaussian copula bit means that you have to transform you data to be normally distributed first, and he recommended rank normalization for that.

(We do that in proteomics too; you want qnorm(rank(x) / (length(x) + 1)), and yeah, that should be in a package somewhere.)

Anders gave a couple of nice examples: he took a 1.4Mpx photo of the sapce shuttle and clustered it by pixel color, and clustered the ranks of a replicated gene study.

He did warn that he hadn’t tested his approach with high-dimensional data though.

Claudia Beleites, whic asked the previous question about high-dimensional data, went on to talk about hierarchical clustering of (you guessed it) high dimensional data. In particular, she was looking at the results of vibrational spectroscopy. This looks at the vibrations of molecules, in this case to try to determine what some tissue consists of.

The data is a big 3D-array: two dimensional images at lots of different spectral frequencies.

Claudia had a bit of a discussion about k-means versus hierarchical modelling. She suggested that the fact that k-means often overlooks small clusters, and the fact that you need to know the number of clusters in advance, meant that it was unsuitable for her datasets. The latter point was vigorously debated after the talk, with Martin Maechler arguing that for k-means analyses, you just try lots of values for the number of clusters, and see what gives you the best answer.

Anyway, Claudia had been using hierarchical clustering, and running into problems with calculation time because she has fairly big datasets and hierarchical clustering takes O(n^2) to run.

Her big breakthrough was to notice that you get more or less the same answer clustering on images, or clustering on spectra, and clustering on spectra takes far less time. She had some magic about compressing the information in spectra (peak detection?) but I didn’t follow that too closely.

Silvia Liverani talked about profile regression clustering and her PReMiuM package. She clearly has better accuracy with the shift key than I do.

Anyway, she said that if you have highly correlated variables (body mass and BMI was her example), it can cause instability and general bad behaviour in your models.

Profile regression models were her solution to this, and she described them as “Bayesian infinite mixture models”, but the technical details went over my head.

The package has support for normal/Poisson/binomial/categorical/censored response variable, missing values, and spatial correlations, so it sounds fully featured.

Silvia said it’s written in C++, but runs MCMC underneath, so tha tmakes it medium speed.

I then dashed off to to the Kaleidoscope session for hear about Karl Broman’s socks.

Kaleidoscope2

Rasmus Bååth talked about using approximate Bayesian computation to solve the infamous Karl Broman’s socks problem. The big selling point of ABC is that you can calculate stuff where you have no idea how the calculate the maximum likelihood. Anyway, I mostly marvelled at Rasmus’s ability to turn a silly subject into a compelling statistical topic.

Keynote

Adrian Baddesley gave a keynote os spatial statistics and his work with the spatstat package. He said that in 1990 when work began on the S version of spatstat, the field of spatial statistics was considered a difficult domain to work in.

“In 1990 I taught that likelihood methods for spatial statistics were infeasible, and that time-series methods were not extensible to spatial problems.”

Since then, the introduction of MCMC, composite likelihood and non-parametric moments have made things easier, but he gave real credit to the R language for pushing things forward.

“For the first time, we could share code easily to make cumulative progress”

One persistent problem in spatial stats was how to deal with edge corrections. If you sample values inside a rectangular area, and try to calculate the distance to their nearest neighbour, then values near the edge appear to be further away because you didn’t match to points that you didn’t sample outside the box.

Apparently large academic wars were fought in the 1980s and early 90s over how best to correct for the edge effects, until R made it easy to compare methods and everyone realised that there wasn’t much difference between them.

Adrian also talked about pixel logistic regression as being a development made by the spatstat team, where you measure the distance from each pixel in an image to a response feature, then do logistic regression on the distances. This turned out to be equivalent to a Poisson point process.

He also said that the structure of R models helped to generate new research questions. The fact that you are supposed to implement residuals and confint and influence functions for every model meant that they had to invent new mathematics to calculate them.

Adrian concluded with the idea that we should seek a grand unification theory for statistics to parallel the attempt to reconcile relativity and quantum physics. Just as several decades ago lm and glm were considered separate classes of model, but today are grouped together, one day we might reconcile frequentist and Bayesian stats.

Lightning talks

These are 5 minute talks.

Rafaël Coudret described an algorithm for SAEM. It was a bit technical, and I didn’t grasp what the “SA” stood for, but the apparently it works well when you can’t figure how how to write the usual Expectation Maximization.

Thomas Leeper talked about the MTurkR interface to Amazon’s Mechanical Turk. This let’s you hire workers to do tasks like image recognition, modify and report on tasks, and even pay the workers, all without leaving the R command line.

In future, he wants to support rival services microWorkers and CrowdFunder too.

Luis Candanedo discussed modelling occupancy detection in offices, to save on the heating and electricity bills. He said that IR sensors are too expensive t obe practical, so he tried using temperature, humidity, light and CO2 sensors to detect the number of people in the office, then used photographs to make it a supervised dataset.

Random forest models showed that the light sensors were best for predicting occupancy.

He didn’t mention it, but knowing how many hospital beds are taken up is maybe an even more important use case. Though you can probably just see who has been allocated where.

Dirk Eddelbuettel talked about his drat package for making local file systems or github (or possibly anywhere else) behave like an R repo.

Basically, it bugs him that if you use devtools::install_github, then you can’t do utils::update.packages on it afterwards, and drat fixes that problem.

Saskia Freytag talked about epilepsy gene sequencing. She had 6 datasets of children’s brains gene expression data, and drew some correlation networks of them. (Actually, I’m not sure if they were correlation networks, or partial correlation networks, which seem to be more popular these days.)

Her idea was that true candidate genes for epilepsy should lie in the same networks as known epilepsy genes, thus filtering out many false negatives.

She also had a Shiny interface to help her non-technical colleagues interact with the networks.

Soma Datta talked about teaching R as a first programming language to secondary school children. She said that many of them found C++ and Java to be too hard, and that R had a much higher success rate.

Simple things like having array indicies start at one rather than zero, not having to bother with semi-colons to terminate lines, and not having to declare variable types made a huge difference to the students ability to be productive.

Alan Friedman talked about Lotka’s Law, which states that a very small number of journal paper authors write most of the papers, and it quickly drops off so that 60% of journal authors only write one paper.

He has an implementation package called LoktasLaw, which librarians might find useful.

Berry Boessenkool talked about extreme value stats. Apparently as the temperature increases, the median chance of precipitation does to. However when you look at the extreme high quantiles (> 99.9%) of the chance of precipitation, they increase upto to a temperature of 25 degrees Celsius or so, then drop again.

Berry suggested that this was a statistical artefact of not having much data, and when he did a more careful extreme value analysis, the high-quantile probability of precipitation kept increasing with temperature, as the underlying physics suggested it should.

When he talked about precipitation, I’m pretty sure he meant rain, since my rudimentary meteorological knowledge suggests that the probability of sleet and snow drops off quite sharply above zero degrees Celsius.

Jonathan Arta talked about his participation in a Kaggle competition predicting NCAA Basketball scores in a knockout competition called March Madness.

His team used results from the previous season’s league games, Las Vegas betting odds, a commercial team metric dataset, and the distance travelled to each game to try to predict the results.

He suggested that they could have done better if they’d used a Bayesian approach: if a poor team wins it’s first couple of games, you know it is better than your model predicts.

Adolfo Alvarez gave a quick rundown of the different approaches for making your code go faster. No time for details, just a big list.

Vectorization, data.table and dplyr, do things in a database, try alternate R engines, parallelize stuff, use GPUs, use Hadoop and Spark, buy time on Amazon or Azure machines.

Karen Nielsen talked about predicting EEG data (those time series of your heart beating) using regression spline mixed models. Her big advance was to include person and trail effects into the model, which was based on the lmer function.

Andrew Kriss talked about his rstats4ag.org website, which gives statistics advice for arable farmers. The stats are fairly basic (on purpose), tailored for use by crop farmers.

Richard Layton talked about teaching graphics. “As well as drawing ‘clear’ graphs, it is important to think about the needs of the audience”, he argued.

While a dot plot may be the best option, if you’re audience had never seen them before, it may be best to use a boxplot instead. (There are no question in the lightning talks, so I didn’t get chance to ask him if he would go so far as to recommend a 4D pie chart!)

One compelling example for considering the psychology of the audience was a mosaic plot of soldiers’ deaths in the (I think first) Iraq war. By itself, the plot evokes little emotion, but if you put a picture of a soldier dying next to it, it reminds you what the numbers mean.

Michael Höhle headlined today with a talk on zombie preparedness, filling in some of the gaps in the Zombie Survival Guide.

He explained that the most important thing was to track possible zombie outbreak metrics in order to ge tan early warning of a problem. He gave a good explanation of monitoring homicides by headshot and decapitation, then correcting for the fact that the civil servants reporting these numbers had gone on holiday.

His surveillance package can also be used for non-zombie related disease outbreaks.

Tagged: r, user2015

To leave a comment for the author, please follow the link and comment on his blog: 4D Pie Charts » R.

R-bloggers.com offers daily e-mail updates about R news and tutorials on topics such as: visualization (ggplot2, Boxplots, maps, animation), programming (RStudio, Sweave, LaTeX, SQL, Eclipse, git, hadoop, Web Scraping) statistics (regression, PCA, time series, trading) and more...

Hygge at UseR! 2015, Aalborg

$
0
0

(This article was first published on Publishable Stuff, and kindly contributed to R-bloggers)


hygge
A Danish word (pronounced HU-guh) meaning social coziness. I.e. the feeling of a good social atmosphere.Urban Dictionary

Yes, there was plenty of hygge to go around this year’s UseR! that took place last week in Aalborg, Denmark. Everybody I’ve spoken with agrees that it was an extraordinary conference, from the interesting speakers and presentations to the flawless organization (spearheaded by Torben Tvedebrink) and the warm weather. As there were many parallel session, I only managed to attend a fraction of the talks, but here are some of my highlights:

  • Romain François, of RCPP and dplyr fame, kicked off the conference with the keynote speech My R adventures which included many cute cat pictures (some might say too many, but don’t listen to them!)
  • I’ve never touched spatial statistics and therefore really enjoyed Adrian Baddeley’s keynote speech How R has changed spatial statistics, which, among other things, introduced me to the spatstat package for spatial statistics in R.
  • Stefan Milton Bache held the presentation Using R in Production which I almost missed due to the boring title (sorry Stefan! :), however, the presentation was far from boring! Stefan’s presentation focused on how to make R code more reliable and easier for others to read using his packages magrittr, import and ensurer. (A cool thing with Stefan’s presentation was that it consisted entirely of screenshots of code, which might sound a tad boring, but which worked really well!)
  • Di Cook held the keynote presentation A Survey of Two Decades of Efforts to Build Interactive Graphics Capacity in R. I haven’t really used interactive graphics that much (except for the very handy manipulate package in RStudio) but I will check out the GGobi package for Interactive and dynamic graphics ASAP.
  • Everything RStudio does is awesome, from the recent improvements to the Rstudio IDE (presented on the Friday by president Tareef Kawaf), to their many packages (two new additions being readxl and readr presented on the Wednesday by Hadley Wickham). But you probably already knew this…
  • I had the pleasure of meeting Mine Çetinkaya-Rundel who is a great R and stats pedagogue, and one of the people behind the free OpenInto textbooks.
  • It’s hard to describe if you weren’t present but Thomas Levine’s presentation on Plotting data as music videos in R made my jaw drop, and I think it is still left in Aalborg. You can find a text version of his presentation here.

Again, this was just a fraction of all the great things that went on at UseR! 2015. Looking forward to UseR! 2016 in Stanford, they have some seriously big Danish shoes to fill. :)

My tutorial and presentation

I was very lucky to be able to contribute both a presentation and a tutorial this UseR, and given the circumstances I believe both went fairly well. (I had planned for ~30 participants at my tutorial, but around 80 showed up!) Below are the slides and material from both my presentation and my tutorial, this is mainly for those that were present as the slides aren’t really self explanatory.

Tutorial: Introduction to Bayesian Data Analysis with R.

This was a three hour tutorial that introduced Bayesian data analysis from scratch using approximate Bayesian computation (which sounds complicated, but is really very intuitive) and the JAGS modeling language.

If you would like me to hold this tutorial (or a shorter version of it) at your organization or university, please contact me at rasmus.baath@gmail.com . I mostly hang out in Sweden and Denmark, but if you can help me with the travel expenses, who knows… :)

The tutorial included some live coding and a number of exercises which can be found here:

As there wasn’t any prediction contest at UseR! this year, the tutorial also included the (unofficial) official UseR! 2015 prediction competition. A candy jar contained an unknown number of Swedish sweet liquorice boats and the goal was to predict that number. Thirty of the boats had been marked red in advanced and when 30 boats were pulled out of the jar at random, three out of the 30 boats were red. Here are the full instructions. Congrats to teams CanFinDen, ScotAm and Potato Boss for all predicting that there were 300 candy boats (which was closest to the actual number of 294 boats). Here is the distribution of answers from the 30 teams, which is nicely centered around 300 (but much more spread out than I would have anticipated, especially since I assumed everybody would use the same method).

Presentation: Tiny Data, Approximate Bayesian Computation and the Socks of Karl Broman

This presentation was based on this blog post and, eventually, I plan to produce a screencast of the presentation.

To leave a comment for the author, please follow the link and comment on his blog: Publishable Stuff.

R-bloggers.com offers daily e-mail updates about R news and tutorials on topics such as: visualization (ggplot2, Boxplots, maps, animation), programming (RStudio, Sweave, LaTeX, SQL, Eclipse, git, hadoop, Web Scraping) statistics (regression, PCA, time series, trading) and more...

Teaching a short topic to beginner R users

$
0
0

(This article was first published on Fellgernon Bit - rstats, and kindly contributed to R-bloggers)

A couple weeks ago I was given the opportunity to teach a 1 hr 30 min slot of an introduction to R course. In the past, I’ve taught lectures for similar courses, and I ended up asking myself what would be the best short topic to teach and how to teach it.

Best short topic

There are two ways to answer the first question, one boring and one more interesting. The boring answer is that the course instructor selected the topic. The interesting one goes like this. I have taken short R courses before and taught others, and it’s always overwhelming for the students. You get to cover many concepts, get familiarized with R‘s syntax, and in the end without lots of practice it’s very challenging to retain much of the information. I think that students love it when they learn how to do something simple that could be the first building block for many of their projects. In parallel, I think that one of the coolest R topics you can learn in an hour is how to create reproducible documents with rmarkdown (Allaire, Cheng, Xie, McPherson, et al., 2015).

Learning how to use a single function, render() in this case, is as simple as it gets. And using the RStudio Desktop is even simpler. Of course, it can easily get complicated. For example, on a new computer you need to install all the LaTeX dependencies if you want to create PDF files. That task can take some time and maybe scare away some new users. But PDF files are really a plus in this case since you can start creating HTML and Word documents. Other complications arise when a user is interested in more control over formatting the file, but like I said earlier, all you need is a simple building block and rmarkdown is clearly one of them.

This is why the final answer to the first question was teaching how to use rmarkdown to create reproducible reports (HTML, Word files) using R.

How to teach it

Teaching a short topic to a beginner’s audience is no easy feat. In the past I’ve made lectures that have the code for every single step and many links to resources where students can learn some details. That is, I’ve created the lectures in such a way that a student can later use them as reference and follow them without an instructor explaining them.

That’s a strategy that I think works on the long run. However, it makes the actual lecture boring and very limited in interactivity. At the JHSPH biostat computing club, other students have chosen to use a lot of images, funny to witty quotes, and asked listeners to voice their opinions. I’ve come to enjoy those presentations and I decided to create my lecture following that trend.

I started off with a series of questions about reproducible research and asked students to voice their opinions and to define a few key concepts. A couple were aware of the difference between reproducibility and replicability, but most were not. I also questioned them and presented them verbally with some famous cases, so they could realize that it’s a fairly complicated matter. Next I presented some answers and definitions from the Implementing Reproducible Research book.

Specifically talking about R, I showed the students several documents I’ve created in the past and asked whether they thought that they could reproduce the results or not. Basically, I wanted to highlight that when using R, you really need the session information if you want to reproduce something. Specially if the analysis involves packages under heavy development.

After having motivating the need for reproducible documents, I briefly showed what rmarkdown is with some images from RStudio shown below.

Markdown overview

Markdown and R

That gave the students a general idea of how these documents look when you are writing them. But the most important part was showing them examples of how the resulting documents look like. That is, I showed them some complicated projects so they could imagine doing one themselves. The examples included some books, but given the audience I think that the one that motivated them most was Alyssa Frazee’s polyester reproducible paper (check the source here). I also showed them some of the cool stuff you can create with HTML documents: basically adding interactive elements.

From there, we left the presentation and I demo’ed how to use RStudio to write rmarkdown documents, the Markdown syntax, where to find help, etc.

Lets code

By this point, I think the lecture was quite complete and the students were motivated. However, from my past experience, I’ve come to realize that students will easily forget a topic if they don’t practice doing it. That is why even before making the lecture I spent quite a bit of time designing two practice labs. Both labs involved creating a rmarkdown document.

The first lab included some cool illusion plots which involved a lot of R code. The code wasn’t the point, but simply learning some of the basics such as what is a code chunk, some of Markdown’s syntax, specifying some code chunk options, adding the session information, and using inline R code to show the date when the document was made. Ahh, and of course, uploading your HTML document to RPubs (see mine). I know that not everyone is a fan of RPubs, but I imagined that students would get super excited that they made something that they could then show their colleagues and friends. And some did!

Sadly, we didn’t have enough time for the second lab. I did explain to the students what it was about, but they didn’t have time to do it themselves. For this second document, I wanted the students to learn how to create a document reporting some results where all the numbers in the text are written by R instead of copy-pasting them.

Conclusions

As you can see, I enjoyed thinking what to teach and specially how to teach a short topic to beginner R students. Thanks to having one of the later sessions, I could teach them how to use rmarkdown in a way that hopefully left them highly motivated to do it themselves. I hope that most of them will take that they learned in that module and others and apply them in their day to day work.

References

You can find the lecture itself here but like I said earlier, it was designed for class and not for being used as a reference. However, the lab and it’s key might be more useful.

Citations made with knitcitations (Boettiger, 2015).

[1]
J. Allaire, J. Cheng, Y. Xie, J. McPherson, et al.
rmarkdown: Dynamic Documents for R.
R package version 0.7.
2015.
URL: http://CRAN.R-project.org/package=rmarkdown.

[2]
C. Boettiger.
knitcitations: Citations for Knitr Markdown Files.
R package version 1.0.6.
2015.
URL: http://CRAN.R-project.org/package=knitcitations.

Want more?

Check other @jhubiostat student blogs at Bmore Biostats as well as topics on #rstats.

To leave a comment for the author, please follow the link and comment on his blog: Fellgernon Bit - rstats.

R-bloggers.com offers daily e-mail updates about R news and tutorials on topics such as: visualization (ggplot2, Boxplots, maps, animation), programming (RStudio, Sweave, LaTeX, SQL, Eclipse, git, hadoop, Web Scraping) statistics (regression, PCA, time series, trading) and more...

Time series outlier detection (a simple R function)

$
0
0

(By Andrea Venturini)

image001

Imagine you have a lot of time series – they may be short ones – related to a lot of different measures and very little time to find outliers. You need something not too sophisticated to solve quickly the mess. This is – very shortly speaking – the typical situation in which you can adopt washer.AV() function in R language. In this linked document (washer) you have the function and an example of actual application in R language:  a data.frame (dati) with temperature and rain (phen) measures (value) in 4 periods of time (time) and in 20 geographical zones (zone). (20*4*2=160  arbitrary observations).

> dati

          phen time zone value

1   Temperature    1  a01   2.0

2   Temperature    1  a02  20.0

160        Rain    4  a20   8.5

 image005 image003

The example of 20 meteorological stations measuring rainfall and temperature is useful to understand in which situation you can implement the washer() methodology. This methodology considers only 3 observations in a group of time series, for instance all 20 terns between time 2 and 4: if the their shape is similar between each other than no outlier will be detected, otherwise – as it happens to the orange time series in the Rain graph above (at time 2, 3 and 4) – a non-parametric test (Sprent test) will flush out the outlier. Look at the graphs above: while the dynamic of temperature is quite linear, rain have a more fluctuating behaviour. A quite different shape – in the sense of difference from linearity of 3 points – is a strong hint of outlier presence. Let’s look atwasher output:

> out=washer.AV(dati)

[1] phenomenon: 1         

[1] phenomenon: 2         


> out[out[,”test.AV”]>5,]


           fen t.2 series  y.1  y.2  y.3 test.AV    AV  n median.AV mad.AV madindex.AV

18        Rain   2    a18  5.5  6.3 17.0    5.43 -22.2 20     7.580   5.49       36.58

38        Rain   3    a18  6.3 17.0  5.9   24.25  47.2 20    -4.978   2.15       14.34

59 Temperature   2    a19 22.0 21.0  9.0    5.25  10.7 20     0.000   2.04       13.63

79 Temperature   3    a19 21.0  9.0 18.0   14.92 -21.2 20    -0.917   1.36        9.07


Sprent test identifies an outlier if test.AV is greater of 5. In the output t.2 represents the time of the second observation; series identifies the time series; y.i (i=1,2,3) are the three observations; AV is an index that approximates the shape of the 3 observations (median and mad of AV are expressed in median.AV and mad.AV); n is the group cardinality; madindex.AVis an attempt to indicate if the shape behaviour inside the group is broadly the same or random at all (see below for insights). In the example of rainfall the anomalous observation is the value 17 at time 3 and it is recognized with  test.AV=24.25, but also at the preceding time (1,2,3) there is a hint of anomaly, even if a weaker one. It is important to understand that even if the trend of these 3 observations is strongly growing, the shape – in the sense of distance from linearity – is not so bad at time t.2=2 respect to t.2=3.        

So, in conclusion:

1.     You need a group of more than 10 time series.

2.     You need at least 3 observations in the time domain.

3.     Time series must have trajectories not completely random but with a similar behaviour in the sense seen above in the example.

The methodology is explained more in detail here: Andrea Venturini; the paper (“Time series outlier detection: a new non parametric methodology (washer)” – Statistica – University of Bologna – 2011 – Vol. 71  pagg. 329-344) can be downloaded here:  Time series outlier detection: a new non parametric methodology (washer).


The network structure of CRAN

$
0
0

(This article was first published on Revolutions, and kindly contributed to R-bloggers)

by Andrie de Vries

My experience of UseR!2015 drew to an end shortly after I gave a Kaleidoscope presentation discussing "The Network Structure of CRAN".

My talk drew heavily on two previous blog posts, Finding the essential R packages using the pagerank algorithm and Finding clusters of CRAN packages using igraph

However, in this talk I went further, attempting to create a single visualiziation of all ~6,700 packages on CRAN. To do this, I did all the analysis in R, then exported a GraphML file, and used Gephi to create a network visualization. 

My first version of the graph was in a single colour, where each node is a package, and each segment is a dependency on another package. Although this graph indicates dense areas, it reveals little of the deeper structure of the network.


CRAN-bw

To examine the structure more closely, I did two things:

  • Use the page.rank() algorithm to compute package importance, then changed the font size so that more "important" packages have a bigger font
  • Used the walktrap.community() algorithm to assign colours to "clusters".  This algorithm uses random walks of a short length to find clusters of densely connected nodes

CRAN-colour


This image (click to enlarge) quite clearly highlights several clusters:

  • MASS, in yellow. This is a large cluster of packages that includes lattice and Matrix, together with many others that seem to expose statistical functionality
  • Rcpp, in light blue. Rcpp allows any package or script to use C++ code for highly performant code
  • ggplot2, in darker blue. This cluster, sometimes called the Hadleyverse, contains packages such as plyr, dplyr and their dependencies, e.g. scales and RColorBrewer.
  • sp, in green. This cluster contains a large number of packages that expose spatial statistics features, including spatstat, maps and mapproj 

It turns out that Rcpp has a slightly higher page rank than MASS. This made Dirk Eddelbuettel very happy:

Eddelbuettel-tweet

You can find my slides at SlideShare and my source code on github.

Finally, my thanks to Gabor Csardi, maintainer of the igraph package, who listened to my ideas and gave helpful hints prior to the presentation.

To leave a comment for the author, please follow the link and comment on his blog: Revolutions.

R-bloggers.com offers daily e-mail updates about R news and tutorials on topics such as: visualization (ggplot2, Boxplots, maps, animation), programming (RStudio, Sweave, LaTeX, SQL, Eclipse, git, hadoop, Web Scraping) statistics (regression, PCA, time series, trading) and more...

“Just the text ma’am” – Web Site Content Extraction with XSLT & R

$
0
0

(This article was first published on Data Driven Security, and kindly contributed to R-bloggers)

Sometimes you just need the salient text from a web site, often as a first step towards natural language processing (NLP) or classification. There are many ways to achieve this, but XSLT (eXtensible Stylesheet Language) was purpose-built for slicing, dicing and transforming XML (and, hence, HTML) so, it can make more sense and even be speedier use XSLT transformations than to a write a hefty bit of R (or other language) code.

R has had XSLT processing capabilities in the past. Sxslt and SXalan both provided extensive XSLT/XML processing capabilities, and Carl Boettiger (@cboettig) has resurrected Sxslt on github. However, it has some legacy memory bugs (just like the XML package does and said bugs were there long before Carl did his reanimation) and is a bit more heavyweight than at least I needed.

Thus, xslt was born. It’s based libxml2 and libxslt so it plays nicely with xml2 and partially wraps xmlwrapp, which is, itself, a C++ wrapper for libxml2 and libxslt.

The github page for the package has installation instructions (you’ll need to be somewhat adventureous until the package matures a bit), but I wanted to demonstrate the utility before refining it.

Using XSLT in Data Analyis Workflows

At work, we maintain an ever-increasing list of public breaches known as the Veris Community Database – VCDB. Each breach is a github issue and we store links to news stories (et al) that document or report the breach in each issue. Coding breaches is pretty labor-intensive work and we have not really received a ton of volunteers (the “C” in “VCDB” stands for “Community”), so we’ve been looking at ways to at least auto-classify the breaches and get some details from them programmatically. This means that getting just the salient text from these news stories/reports is critical.

With the xslt package, we can use an XSLT tranformation (that XSLT file is a bit big, mostly due to my XSLT being rusty) in an rvest/xml2 pipeline to extract just the text.

Here’s a sample of it in action with apologies for the somewhat large text chunks:

library(xslt)
library(stringr)
library(xml2)
library(rvest)

just_the_text_maam <- function(doc, sheet) {
  xslt_transform(doc, sheet, is_html = TRUE, fix_ns = TRUE) %>%
    html_text %>%
    str_replace_all("[\r\n]", "") %>%
    str_replace_all("[[:blank:]]+", " ") %>%
    str_trim
}

sheet <- read_xslt("http://dds.ec/dl/justthetext.xslt")

just_the_text_maam("http://krebsonsecurity.com/2015/07/banks-card-breach-at-trump-hotel-properties/", sheet)

## [1] "01Jul 15 Banks: Card Breach at Trump Hotel Properties The Trump Hotel Collection, a string of luxury hotel properties tied to business magnate and , appears to be the latest victim of a credit card breach, according to data shared by several U.S.-based banks.Trump International Hotel and Tower in Chicago.Contacted regarding reports from sources at several banks who traced a pattern of fraudulent debit and credit card charges to accounts that had all been used at Trump hotels, the company declined multiple requests for comment.Update, 4:56 p.m. ET: The Trump Organization just acknowledged the issue with a brief statement from Eric Trump, executive vice president of development and acquisitions: “Like virtually every other company these days, we have been alerted to potential suspicious credit card activity and are in the midst of a thorough investigation to determine whether it involves any of our properties,” the statement reads. “We are committed to safeguarding all guests’ personal information and will continue to do so vigilantly.”Original story:But sources in the financial industry say they have little doubt that Trump properties in several U.S. locations — including Chicago, Honolulu, Las Vegas, Los Angeles, Miami, and New York — are dealing with a card breach that appears to extend back to at least February 2015.If confirmed, the incident would be the latest in a long string of credit card breaches involving hotel brands, restaurants and retail establishments. In March, upscale hotel chain Mandarin Oriental . The following month, hotel franchising firm White Lodging acknowledged that, , card processing systems at several of its locations were breached by hackers.It is likely that the huge number of card breaches at U.S.-based organizations over the past year represents a response by fraudsters to upcoming changes in the United States designed to make credit and debit cards more difficult and expensive to counterfeit. Non-chip cards store cardholder data on a magnetic stripe, which can be trivially copied and re-encoded onto virtually anything else with a magnetic stripe.Magnetic-stripe based cards are the primary target for hackers who have been breaking into retailers like and and installing malicious software on the cash registers: The data is quite valuable to crooks because it can be sold to thieves who encode the information onto new plastic and go shopping at big box stores for stuff they can easily resell for cash (think high-dollar gift cards and electronics).In October 2015, merchants that have not yet installed card readers which accept more secure chip-based cards will for the cost of fraud from counterfeit cards. While most experts believe it may be years after that deadline before most merchants have switched entirely to chip-based card readers (and many U.S. banks are only now thinking about issuing chip-based cards to customers) cyber thieves no doubt well understand they won’t have this enormously profitable cash cow around much longer, and they’re busy milking it for all it’s worth.For more on chip cards and why most U.S. banks are moving to chip-and-signature over the more widely used chip-and-PIN approach, check out . Tags: , , , , , , , , , , Leave a comment Read previous post:Cybercriminals have long relied on compromised Web sites to host malicious software for use in drive-by download attacks, but at..."

just_the_text_maam("http://www.csoonline.com/article/2943968/data-breach/hacking-team-hacked-attackers-claim-400gb-in-dumped-data.html", sheet)

## [1] "Firm made famous for helping governments spy on their citizens left exposed CSO | Jul 5, 2015 6:53 PM PT On Sunday, while most of Twitter was watching the Women's World Cup – an amazing game from start to finish – one of the world's most notorious security firms was being hacked.Note: This story is the first of two on the Hacking Team incident. In addition, of visuals from the hack is also available.Specializing in surveillance technology, Hacking Team is now learning how it feels to have their internal matters exposed to the world, and privacy advocates are enjoying a bit of schadenfreude at their expense.Hacking Team is an Italian company that sells intrusion and surveillance tools to governments and law enforcement agencies.The lawful interception tools developed by this company have been linked to several cases of privacy invasion by researchers and the media.Reporters Without Borders has listed the company due largely to Hacking Teams' business practices and their primary surveillance tool Da Vinci.It isn't known who hacked Hacking Team; however, the attackers have published a Torrent file with 400GB of internal documents, source code, and email communications to the public at large.In addition, the attackers have taken to Twitter, defacing the Hacking Team account with a new logo, biography, and published messages with images of the compromised data.Salted Hash will continue to follow developments and update as needed.Update 1: Christopher Soghoian , Hacking Team's customers include South Korea, Kazakhstan, Saudi Arabia, Oman, Lebanon, and Mongolia. Yet, the company maintains that it does not do business with oppressive governments.Update 2: Researchers have started to post items from the released Torrent file. One such item is this invoice for 58,000 Euro to Egypt for Hacking Team's RCS Exploit Portal.Update 3: The video below is a commercial for Hacking Team's top tool Da Vinci.Update 4:An email from a person linked to several domains allegedly tied to the Meles Zenawi Foundation (MZF), Ethiopia's Prime Minister until his death in 2012, was published Sunday evening as part of the cache of files taken from Hacking Team.In the email, Biniam Tewolde offers his thanks to Hacking Team for their help in getting a high value target.Around the time the email was sent, which was eight months after the Prime Minister's death, Tewolde had registered eight different MZF related domains. Given the context of the email and the sudden appearance (and disappearance) of the domains, it's possible all of them were part of a Phishing campaign to access the target. Who the high value target is, remains unknown.An invoice leaked with the Hacking Team cache shows that Ethiopia paid $1,000,000 Birr (ETB) for Hacking Team's Remote Control System, professional services, and communications equipment.Update 5:Hacking Team currently has, based on internal documents leaked by the attackers on Sunday evening, customers in the following locations:Egypt, Ethiopia, Morocco, Nigeria, SudanChile, Colombia, Ecuador, Honduras, Mexico, Panama, United StatesAzerbaijan, Kazakhstan, Malaysia, Mongolia, Singapore, South Korea, ThailandUzbekistan, Vietnam, Australia, Cyprus, Czech Republic, Germany, HungaryItaly, Luxemburg, Poland, Russia, Spain, Switzerland, Bahrain, OmanSaudi Arabia, UAEThe list, and subsequent invoice for 480,000 Euro, disproves Hacking Team's claims that they have never done business with Sudan. , Sudanese security forces have repeatedly and violently suppressed protestors demonstrating against the government, with more than 170 killed in 2013.Update 6: Is Hacking Team awake yet?It's 0100 EST, so sometime soon, , someone in Italy is about to have very a bad day.Late Sunday evening, the Twitter account used by Hacking Team was defaced, and a link to a 400GB Torrent file was posted. The file contains a number of newsworthy items, particularly when it comes to the questionable business relationships between Hacking Team and nations that aren't known for their positive outlook on basic human rights.New developments in the Hacking Team incident include the release of a document outlining the maintenance agreement status of various customers. The document, shared with Salted Hash, lists Russia and Sudan as clients, but instead of an 'active' or 'expired' flag on their account, the two nations are listed as "Not officially supported"--The list of clients in the maintenance tracker is similar to the client list provided in the previous update. It's worth mentioning that the Department of Defense is listed as not active, while the Drug Enforcement Agency (DEA) has a renewal in progress. The document notes that the FBI had an active maintenance contract with Hacking Team until June 30, 2015.The 2010 contact between Hacking Team and the National Intelligence Centre (CNI) of Spain was released as part of the cache. According to records, they are listed as an active EU customer with a maintenance contract until 31 January 2016. At the time the contract was signed, the total financial consideration to Hacking Team is listed at 3.4 million Euros.Hacking Team's Christian Pozzi was personally exposed by the incident, as the security engineer's password store from Firefox was published as part of the massive data dump. The passwords in the file are of poor quality, using a mix of easily guessed patterns or passwords that are commonly known to security engineers and criminal hackers. The websites indexed include social media (Live, Facebook, LinkedIn), financial (banks, PayPal), and network related (routers with default credentials).However, Pozzi wasn't the only one to have passwords leaked. Clients have had their passwords exposed as well, as several documents related to contracts and configurations have been circulating online. Unfortunately, the passwords that are circulating are just as bad as the ones observed in the Firefox file.Here are some examples:HTPassw0rdPassw0rd!81Passw0rdPassw0rd!Pas$w0rdRite1.!!Update 7:Among the leaked documents shared by are client details, including a number of configuration and access documents. Based on the data, it appears that Hacking Team told clients in Egypt and Lebanon to use VPN services based in the United States and Germany.--"

just_the_text_maam("http://datadrivensecurity.info/blog/posts/2015/Jul/hiring-data-scientist/", sheet)

## [1] "Five Critical Points To Consider When Hiring a Data Scientist By Jay Jacobs (@jayjacobs) Tue 07 July 2015 | tags: , -- () I was recently asked for advice on hiring someone for a data science role. I gave some quick answers but thought the topic deserved more thought because I’ve not only had the experience of hiring for data science but also interviewing (I have recently changed jobs - hello ). So without much of an intro, here are the top 5 pieces of advice I would give to any company trying to hire a data scientist. Put data where their mouth isThis is probably the single best piece of advice I can give and should help you understand more about a candidate then any set of questions. At first, I was surprised when a company gave me a large file to explore and report back on, but in hindsight it’s brilliant. It’s clever because (as I’ve learned), most applicants can talk the talk, but there is a lot of variation in the walks. If at all possible, you should use data from your environment, preferably a sample of data they’d be working on. Don’t expect them to build a complex model or anything, just ask them to come back with either a written report and/or verbal presentation on what the data is.You are looking for three very critical skills. First, you should expect them to identify one or more interesting questions about the data. A big skill of working with data is identifying good questions that can be answered by the data. The good and interesting parts are very critical because many questions are easy, but good questions that are interesting and that deserved to be answered is where skill comes in. Second, look for the train of thought and evidence of building on previous work. You are asking them to do exploratory data analysis, which is all about building up the analyst’s intuition about the data. Be sure you see signs of discovery and learning (about the data, not the analysis). Third, you are looking for their communication skills. Can they present on data-driven topics? Did they leverage visualizations to explain what they’ve learned? And that bridges into the next bit of advice…Don’t be afraid to look dumb.I’m sorry to say that I’ve seen a whole lot of bad research being accepted at face value because people were too afraid say something thinking they would look dumb. If something doesn’t make sense, or doesn’t quite smell right, speak up and ask for clarification on whatever doesn’t sit right. The worst you can do is to just assume they must be right since it seems like they know what they are talking about. I’m serious about this. I’ve seen entire rooms of people nodding their heads to someone saying the equivalent of 2 + 2 = 5. Speak up and ask for clarification. It’s okay if you don’t get something, this is why you want to hire a data scientist anyway. You won’t discover what’s really going on under the surface until you dig a little and unfortunately it can be tricky. What you want to know is that they can talk you like an equal and explain things to a satisfactory level. Remember if they can’t explain the simple things in an interview, how will they explain more complex topics on the job?Don’t try to stump candidatesThe flip side to asking for explanations is a bit of a personal pet peeve. Some interviewers like to pull together technical questions to see if the candidate knows their facts. But here’s a not-so-little secret, data scientists (like everyone else) do much better work with the internet than without. Don’t put them on the spot and ask them to verbally explain the intricacies of the such-n-such algorithm or to list all the assumptions in a specific modeling technique. If these types of questions are critical to the job do a written set of questions and let them use the tools they would use on the job. Sure, you’d like to ensure they know their stuff, but ask technical questions broadly and don’t expect a single specific answer, but just see if they can talk about what things they would need to look out for. Find out what they have done.Ask about projects they have done and I like to follow the . First have then describe a situation, problem or challenge, then have them talk about the tasks or what they needed to achieve in order to resolve the situation (build a classifier, perform regression, etc). Then find out exactly what they contributed and what their actions were. Be sure to hone in on their role, especially if the project is done in academia where teams of research are more common. Finally how did it turn out (the results)? How did they evaluate their work and did the results meet expectations? Having them talk through a project like that should help you get to know them a little more. Don’t hold out for a full-stack data scientistIdeally, a good “full stack” data scientist will have the following skills:Domain expertise - understanding of the industry is helpful at every stage of analyses.Good programming skills - perhaps look for public examples ()Statistics – because data uses it own langaugeMachine learning – because sometimes machines can be better, fast and smarter than you and IData management – the data has to live somewhereVisualizations – data science is pointless unless it can be communicated.But don’t hold out for the full stack of skills. Every candidate will be stronger in one or two of these than the rest, so identify what skills are critical to the role and what may not be as important. Than hire for those strengths. Hope those are helpful, if you have more, leave a comment with your ideas and tips! Please enable JavaScript to view the"

(those are links from three recent breaches posted to VCDB).

Those operations are also pretty fast:

system.time(just_the_text_maam("http://krebsonsecurity.com/2015/07/banks-card-breach-at-trump-hotel-properties/", sheet))
##    user  system elapsed 
##   0.089   0.102   0.199

system.time(just_the_text_maam("http://www.csoonline.com/article/2943968/data-breach/hacking-team-hacked-attackers-claim-400gb-in-dumped-data.html", sheet))
##    user  system elapsed 
##   0.127   0.179   0.311

system.time(just_the_text_maam("http://datadrivensecurity.info/blog/posts/2015/Jul/hiring-data-scientist/", sheet))
##    user  system elapsed 
##   0.034   0.043   0.078

(more benchmarks that exclude the randomness of download speeds will be forthcoming).

Rather than focus on handling tags, attributes and doing some fancy footwork with regular expressions (like all the various readability ports do), you get to focus on the data analysis pipeline, with text that’s pretty clean (you can see it misses some things) and also pretty much ready for LDA or other text analysis.

The xmlwrapp C++ library doesn’t have much functionality beyond the transformation function, so there may not be much more added to this package. There is one extra option—to pass parameters to XSLT transformation scripts—that will be coded up in short order.

If you find a use for xslt (or a bug) drop us a note here or on github.

To leave a comment for the author, please follow the link and comment on his blog: Data Driven Security.

R-bloggers.com offers daily e-mail updates about R news and tutorials on topics such as: visualization (ggplot2, Boxplots, maps, animation), programming (RStudio, Sweave, LaTeX, SQL, Eclipse, git, hadoop, Web Scraping) statistics (regression, PCA, time series, trading) and more...

“Just the text ma’am” – Web Site Content Extraction with XSLT & R

$
0
0

(This article was first published on Data Driven Security, and kindly contributed to R-bloggers)

Sometimes you just need the salient text from a web site, often as a first step towards natural language processing (NLP) or classification. There are many ways to achieve this, but XSLT (eXtensible Stylesheet Language) was purpose-built for slicing, dicing and transforming XML (and, hence, HTML) so, it can make more sense and even be speedier use XSLT transformations than to a write a hefty bit of R (or other language) code.

R has had XSLT processing capabilities in the past. Sxslt and SXalan both provided extensive XSLT/XML processing capabilities, and Carl Boettiger (@cboettig) has resurrected Sxslt on github. However, it has some legacy memory bugs (just like the XML package does and said bugs were there long before Carl did his reanimation) and is a bit more heavyweight than at least I needed.

Thus, xslt was born. It’s based libxml2 and libxslt so it plays nicely with xml2 and partially wraps xmlwrapp, which is, itself, a C++ wrapper for libxml2 and libxslt.

The github page for the package has installation instructions (you’ll need to be somewhat adventureous until the package matures a bit), but I wanted to demonstrate the utility before refining it.

Using XSLT in Data Analyis Workflows

At work, we maintain an ever-increasing list of public breaches known as the Veris Community Database – VCDB. Each breach is a github issue and we store links to news stories (et al) that document or report the breach in each issue. Coding breaches is pretty labor-intensive work and we have not really received a ton of volunteers (the “C” in “VCDB” stands for “Community”), so we’ve been looking at ways to at least auto-classify the breaches and get some details from them programmatically. This means that getting just the salient text from these news stories/reports is critical.

With the xslt package, we can use an XSLT tranformation (that XSLT file is a bit big, mostly due to my XSLT being rusty) in an rvest/xml2 pipeline to extract just the text.

Here’s a sample of it in action with apologies for the somewhat large text chunks:

library(xslt)
library(stringr)
library(xml2)    # this requires a "devtools" install of "xml2" : devtools::install_github("hadley/xml2")
library(rvest)   # this requires a "devtools" install of "rvest" : devtools::install_github("hadley/rvest")

just_the_text_maam <- function(doc, sheet) {
  xslt_transform(doc, sheet, is_html = TRUE, fix_ns = TRUE) %>%
    html_text %>%
    str_replace_all("[\r\n]", "") %>%
    str_replace_all("[[:blank:]]+", " ") %>%
    str_trim
}

sheet <- read_xslt("http://dds.ec/dl/justthetext.xslt")

just_the_text_maam("http://krebsonsecurity.com/2015/07/banks-card-breach-at-trump-hotel-properties/", sheet)

## [1] "01Jul 15 Banks: Card Breach at Trump Hotel Properties The Trump Hotel Collection, a string of luxury hotel properties tied to business magnate and , appears to be the latest victim of a credit card breach, according to data shared by several U.S.-based banks.Trump International Hotel and Tower in Chicago.Contacted regarding reports from sources at several banks who traced a pattern of fraudulent debit and credit card charges to accounts that had all been used at Trump hotels, the company declined multiple requests for comment.Update, 4:56 p.m. ET: The Trump Organization just acknowledged the issue with a brief statement from Eric Trump, executive vice president of development and acquisitions: “Like virtually every other company these days, we have been alerted to potential suspicious credit card activity and are in the midst of a thorough investigation to determine whether it involves any of our properties,” the statement reads. “We are committed to safeguarding all guests’ personal information and will continue to do so vigilantly.”Original story:But sources in the financial industry say they have little doubt that Trump properties in several U.S. locations — including Chicago, Honolulu, Las Vegas, Los Angeles, Miami, and New York — are dealing with a card breach that appears to extend back to at least February 2015.If confirmed, the incident would be the latest in a long string of credit card breaches involving hotel brands, restaurants and retail establishments. In March, upscale hotel chain Mandarin Oriental . The following month, hotel franchising firm White Lodging acknowledged that, , card processing systems at several of its locations were breached by hackers.It is likely that the huge number of card breaches at U.S.-based organizations over the past year represents a response by fraudsters to upcoming changes in the United States designed to make credit and debit cards more difficult and expensive to counterfeit. Non-chip cards store cardholder data on a magnetic stripe, which can be trivially copied and re-encoded onto virtually anything else with a magnetic stripe.Magnetic-stripe based cards are the primary target for hackers who have been breaking into retailers like and and installing malicious software on the cash registers: The data is quite valuable to crooks because it can be sold to thieves who encode the information onto new plastic and go shopping at big box stores for stuff they can easily resell for cash (think high-dollar gift cards and electronics).In October 2015, merchants that have not yet installed card readers which accept more secure chip-based cards will for the cost of fraud from counterfeit cards. While most experts believe it may be years after that deadline before most merchants have switched entirely to chip-based card readers (and many U.S. banks are only now thinking about issuing chip-based cards to customers) cyber thieves no doubt well understand they won’t have this enormously profitable cash cow around much longer, and they’re busy milking it for all it’s worth.For more on chip cards and why most U.S. banks are moving to chip-and-signature over the more widely used chip-and-PIN approach, check out . Tags: , , , , , , , , , , Leave a comment Read previous post:Cybercriminals have long relied on compromised Web sites to host malicious software for use in drive-by download attacks, but at..."

just_the_text_maam("http://www.csoonline.com/article/2943968/data-breach/hacking-team-hacked-attackers-claim-400gb-in-dumped-data.html", sheet)

## [1] "Firm made famous for helping governments spy on their citizens left exposed CSO | Jul 5, 2015 6:53 PM PT On Sunday, while most of Twitter was watching the Women's World Cup – an amazing game from start to finish – one of the world's most notorious security firms was being hacked.Note: This story is the first of two on the Hacking Team incident. In addition, of visuals from the hack is also available.Specializing in surveillance technology, Hacking Team is now learning how it feels to have their internal matters exposed to the world, and privacy advocates are enjoying a bit of schadenfreude at their expense.Hacking Team is an Italian company that sells intrusion and surveillance tools to governments and law enforcement agencies.The lawful interception tools developed by this company have been linked to several cases of privacy invasion by researchers and the media.Reporters Without Borders has listed the company due largely to Hacking Teams' business practices and their primary surveillance tool Da Vinci.It isn't known who hacked Hacking Team; however, the attackers have published a Torrent file with 400GB of internal documents, source code, and email communications to the public at large.In addition, the attackers have taken to Twitter, defacing the Hacking Team account with a new logo, biography, and published messages with images of the compromised data.Salted Hash will continue to follow developments and update as needed.Update 1: Christopher Soghoian , Hacking Team's customers include South Korea, Kazakhstan, Saudi Arabia, Oman, Lebanon, and Mongolia. Yet, the company maintains that it does not do business with oppressive governments.Update 2: Researchers have started to post items from the released Torrent file. One such item is this invoice for 58,000 Euro to Egypt for Hacking Team's RCS Exploit Portal.Update 3: The video below is a commercial for Hacking Team's top tool Da Vinci.Update 4:An email from a person linked to several domains allegedly tied to the Meles Zenawi Foundation (MZF), Ethiopia's Prime Minister until his death in 2012, was published Sunday evening as part of the cache of files taken from Hacking Team.In the email, Biniam Tewolde offers his thanks to Hacking Team for their help in getting a high value target.Around the time the email was sent, which was eight months after the Prime Minister's death, Tewolde had registered eight different MZF related domains. Given the context of the email and the sudden appearance (and disappearance) of the domains, it's possible all of them were part of a Phishing campaign to access the target. Who the high value target is, remains unknown.An invoice leaked with the Hacking Team cache shows that Ethiopia paid $1,000,000 Birr (ETB) for Hacking Team's Remote Control System, professional services, and communications equipment.Update 5:Hacking Team currently has, based on internal documents leaked by the attackers on Sunday evening, customers in the following locations:Egypt, Ethiopia, Morocco, Nigeria, SudanChile, Colombia, Ecuador, Honduras, Mexico, Panama, United StatesAzerbaijan, Kazakhstan, Malaysia, Mongolia, Singapore, South Korea, ThailandUzbekistan, Vietnam, Australia, Cyprus, Czech Republic, Germany, HungaryItaly, Luxemburg, Poland, Russia, Spain, Switzerland, Bahrain, OmanSaudi Arabia, UAEThe list, and subsequent invoice for 480,000 Euro, disproves Hacking Team's claims that they have never done business with Sudan. , Sudanese security forces have repeatedly and violently suppressed protestors demonstrating against the government, with more than 170 killed in 2013.Update 6: Is Hacking Team awake yet?It's 0100 EST, so sometime soon, , someone in Italy is about to have very a bad day.Late Sunday evening, the Twitter account used by Hacking Team was defaced, and a link to a 400GB Torrent file was posted. The file contains a number of newsworthy items, particularly when it comes to the questionable business relationships between Hacking Team and nations that aren't known for their positive outlook on basic human rights.New developments in the Hacking Team incident include the release of a document outlining the maintenance agreement status of various customers. The document, shared with Salted Hash, lists Russia and Sudan as clients, but instead of an 'active' or 'expired' flag on their account, the two nations are listed as "Not officially supported"--The list of clients in the maintenance tracker is similar to the client list provided in the previous update. It's worth mentioning that the Department of Defense is listed as not active, while the Drug Enforcement Agency (DEA) has a renewal in progress. The document notes that the FBI had an active maintenance contract with Hacking Team until June 30, 2015.The 2010 contact between Hacking Team and the National Intelligence Centre (CNI) of Spain was released as part of the cache. According to records, they are listed as an active EU customer with a maintenance contract until 31 January 2016. At the time the contract was signed, the total financial consideration to Hacking Team is listed at 3.4 million Euros.Hacking Team's Christian Pozzi was personally exposed by the incident, as the security engineer's password store from Firefox was published as part of the massive data dump. The passwords in the file are of poor quality, using a mix of easily guessed patterns or passwords that are commonly known to security engineers and criminal hackers. The websites indexed include social media (Live, Facebook, LinkedIn), financial (banks, PayPal), and network related (routers with default credentials).However, Pozzi wasn't the only one to have passwords leaked. Clients have had their passwords exposed as well, as several documents related to contracts and configurations have been circulating online. Unfortunately, the passwords that are circulating are just as bad as the ones observed in the Firefox file.Here are some examples:HTPassw0rdPassw0rd!81Passw0rdPassw0rd!Pas$w0rdRite1.!!Update 7:Among the leaked documents shared by are client details, including a number of configuration and access documents. Based on the data, it appears that Hacking Team told clients in Egypt and Lebanon to use VPN services based in the United States and Germany.--"

just_the_text_maam("http://datadrivensecurity.info/blog/posts/2015/Jul/hiring-data-scientist/", sheet)

## [1] "Five Critical Points To Consider When Hiring a Data Scientist By Jay Jacobs (@jayjacobs) Tue 07 July 2015 | tags: , -- () I was recently asked for advice on hiring someone for a data science role. I gave some quick answers but thought the topic deserved more thought because I’ve not only had the experience of hiring for data science but also interviewing (I have recently changed jobs - hello ). So without much of an intro, here are the top 5 pieces of advice I would give to any company trying to hire a data scientist. Put data where their mouth isThis is probably the single best piece of advice I can give and should help you understand more about a candidate then any set of questions. At first, I was surprised when a company gave me a large file to explore and report back on, but in hindsight it’s brilliant. It’s clever because (as I’ve learned), most applicants can talk the talk, but there is a lot of variation in the walks. If at all possible, you should use data from your environment, preferably a sample of data they’d be working on. Don’t expect them to build a complex model or anything, just ask them to come back with either a written report and/or verbal presentation on what the data is.You are looking for three very critical skills. First, you should expect them to identify one or more interesting questions about the data. A big skill of working with data is identifying good questions that can be answered by the data. The good and interesting parts are very critical because many questions are easy, but good questions that are interesting and that deserved to be answered is where skill comes in. Second, look for the train of thought and evidence of building on previous work. You are asking them to do exploratory data analysis, which is all about building up the analyst’s intuition about the data. Be sure you see signs of discovery and learning (about the data, not the analysis). Third, you are looking for their communication skills. Can they present on data-driven topics? Did they leverage visualizations to explain what they’ve learned? And that bridges into the next bit of advice…Don’t be afraid to look dumb.I’m sorry to say that I’ve seen a whole lot of bad research being accepted at face value because people were too afraid say something thinking they would look dumb. If something doesn’t make sense, or doesn’t quite smell right, speak up and ask for clarification on whatever doesn’t sit right. The worst you can do is to just assume they must be right since it seems like they know what they are talking about. I’m serious about this. I’ve seen entire rooms of people nodding their heads to someone saying the equivalent of 2 + 2 = 5. Speak up and ask for clarification. It’s okay if you don’t get something, this is why you want to hire a data scientist anyway. You won’t discover what’s really going on under the surface until you dig a little and unfortunately it can be tricky. What you want to know is that they can talk you like an equal and explain things to a satisfactory level. Remember if they can’t explain the simple things in an interview, how will they explain more complex topics on the job?Don’t try to stump candidatesThe flip side to asking for explanations is a bit of a personal pet peeve. Some interviewers like to pull together technical questions to see if the candidate knows their facts. But here’s a not-so-little secret, data scientists (like everyone else) do much better work with the internet than without. Don’t put them on the spot and ask them to verbally explain the intricacies of the such-n-such algorithm or to list all the assumptions in a specific modeling technique. If these types of questions are critical to the job do a written set of questions and let them use the tools they would use on the job. Sure, you’d like to ensure they know their stuff, but ask technical questions broadly and don’t expect a single specific answer, but just see if they can talk about what things they would need to look out for. Find out what they have done.Ask about projects they have done and I like to follow the . First have then describe a situation, problem or challenge, then have them talk about the tasks or what they needed to achieve in order to resolve the situation (build a classifier, perform regression, etc). Then find out exactly what they contributed and what their actions were. Be sure to hone in on their role, especially if the project is done in academia where teams of research are more common. Finally how did it turn out (the results)? How did they evaluate their work and did the results meet expectations? Having them talk through a project like that should help you get to know them a little more. Don’t hold out for a full-stack data scientistIdeally, a good “full stack” data scientist will have the following skills:Domain expertise - understanding of the industry is helpful at every stage of analyses.Good programming skills - perhaps look for public examples ()Statistics – because data uses it own langaugeMachine learning – because sometimes machines can be better, fast and smarter than you and IData management – the data has to live somewhereVisualizations – data science is pointless unless it can be communicated.But don’t hold out for the full stack of skills. Every candidate will be stronger in one or two of these than the rest, so identify what skills are critical to the role and what may not be as important. Than hire for those strengths. Hope those are helpful, if you have more, leave a comment with your ideas and tips! Please enable JavaScript to view the"

(those are links from three recent breaches posted to VCDB).

Those operations are also pretty fast:

system.time(just_the_text_maam("http://krebsonsecurity.com/2015/07/banks-card-breach-at-trump-hotel-properties/", sheet))
##    user  system elapsed 
##   0.089   0.102   0.199

system.time(just_the_text_maam("http://www.csoonline.com/article/2943968/data-breach/hacking-team-hacked-attackers-claim-400gb-in-dumped-data.html", sheet))
##    user  system elapsed 
##   0.127   0.179   0.311

system.time(just_the_text_maam("http://datadrivensecurity.info/blog/posts/2015/Jul/hiring-data-scientist/", sheet))
##    user  system elapsed 
##   0.034   0.043   0.078

(more benchmarks that exclude the randomness of download speeds will be forthcoming).

Rather than focus on handling tags, attributes and doing some fancy footwork with regular expressions (like all the various readability ports do), you get to focus on the data analysis pipeline, with text that’s pretty clean (you can see it misses some things) and also pretty much ready for LDA or other text analysis.

The xmlwrapp C++ library doesn’t have much functionality beyond the transformation function, so there may not be much more added to this package. There is one extra option—to pass parameters to XSLT transformation scripts—that will be coded up in short order.

If you find a use for xslt (or a bug) drop us a note here or on github.

To leave a comment for the author, please follow the link and comment on his blog: Data Driven Security.

R-bloggers.com offers daily e-mail updates about R news and tutorials on topics such as: visualization (ggplot2, Boxplots, maps, animation), programming (RStudio, Sweave, LaTeX, SQL, Eclipse, git, hadoop, Web Scraping) statistics (regression, PCA, time series, trading) and more...

The Workflow of Infinite Shame, and other stories from the R Summit

$
0
0

(This article was first published on 4D Pie Charts » R, and kindly contributed to R-bloggers)

At day one of the R Summit at Copenhagen Business School there was a lot of talk about the performance of R, and alternate R interpreters.

Luke Tierney of the University of Iowa, the author of the compiler package, and R-Core member who has been working on R’s performance since, well, pretty much since R was created, talked about future improvements to R’s internals.

Plans to improve R’s performance include implementing proper reference counting (that is tracking how many variables point at a particular bit of memory; the current version counts like zero/one/two-or-more, and a more accurate count means you can do less copying). Improving scalar performance and reducing function overhead are high priorities for performance enhancement. Currently when you do something like

for(i in 1:100000000) {}

R will assign a vector of length 100000000, which takes a ridiculous amount of memory. By being smart and realising that you only ever need one number at a time, you can store the vector much more efficiently. The same principle applies for seq_len and seq_along.

Other possible performance improvements that Luke discussed include having a more efficient data structure for environments, and storing the results of complex objects like model results more efficiently. (How often do you use that qr element in an lm model anyway?

Tomas Kalibera of Northeastern University has been working on a tool for finding PROTECT bugs in the R internals code. I last spoke to Tomas in 2013 when he was working with Jan Vitek on the alternate R engine, FastR. See Fearsome Engines part 1, part 2, part 3. Since then FastR has become a purely Oracle project (more on that in a moment), and the Purdue University fork of FastR has been retired.

The exact details of the PROTECT macro went a little over my head, but the essence is that it is used to stop memory being overwritten, and it’s a huge source of obscure bugs in R.

Lukas Stadler of Oracle Labs is the heir to the FastR throne. The Oracle Labs team have rebuilt it on top of Truffle, an Oracle product for generating dynamically optimized Java bytecode that can then be run on the JVM. Truffle’s big trick is that it can auto-generate this byte code for a variety of languages: R, Ruby and JavaScript are the officially supported languages, with C, Python and SmallTalk as side-projects. Lukas claimed that peak performance (that is, “on a good day”) for Truffle-generated code is comparable to language-specific optimized code.

Non-vectorised code is the main beneficiary of the speedup. He had a cool demo where a loopy version of the sum function ran slowly, then Truffle learned how to optimise it, and the result became almost as fast as the built-in sum function.

He has a complaint that the R.h API from R to C is really and API from GNU R to C, that is, it makes too many assumptions about how GNU works, and these don’t hold true when you are running a Java version of R.

Maarten-Jan Kallen from BeDataDriven works on Renjin, the other R interpreter built on top of the JVM. Based on his talk, and some other discussion with Maarten, it seems that there is a very clear mission-statement for Renjin: BeDataDriven just want a version of R that runs really fast inside Google App Engine. They also count an interesting use case forRenjin – it is currently powering software for the United Nations’ humanitarian effort in Syria.

Back to the technical details, Maarten showed an example where R 3.0.0 introduced the anyNA function as a fast version of any(is.na(x)). In the case of Renjin, this isn’t necessary since it works quickly anyway. (Though if Luke Tierney’s talk come true, it won’t be needed in GNU R soon either.)

Calling external code still remains a problem for Renjin; in particular Rcpp and it’s reverse dependencies won’t build for it. The spread of Rcpp, he lamented, even includes roxygen2.

Hannes Mühleisen has also been working with BeDataDriven, and completed Maarten’s talk. He previously worked on integrating MonetDB with R, and has been applying his database expertise to Renjin. In the same way that when you run a query in a database, it generates a query plan to try and find the most efficient way of retrieving your results, Renjin now generates a query plan to find the most efficient way to evaluate your code. That means using a deferred execution system where you avoid calculating things until the last minute, and in some cases not at all because another calculation makes them obsolete.

Karl Millar from Google has been working on CXXR. This was a bit of a shock to me. When I interviewed Andrew Runnalls in 2013, he didn’t really sell CXXR to me particularly well. The project goals at the time were to clean up the GNU R code base, rewriting it in modern C++, and documenting it properly to use as a reference implementation of R. It all seemed a bit of academic fun rather than anything useful. Since Google has started working on the project, the focus has changed. It is now all about having a high performance version of R.

I asked Andrew why he choose CXXR for this purpose. After all, of the half a dozen alternate R engines, CXXR was the only one that didn’t explicitly have performance as a goal. His response was that it has nearly 100% code compatibility with GNU R, and that the code is so clear that it makes it easy to make changes.

That talk focussed on some of the difficulties of optimizing R code. For example, in the assignment

a <- b + c

you don’t know how long b and c are, or what their classes are, so you have to spend a long time looking things up. At runtime however, you can guess a bit better. b and c are probably the same size and class as what you used last time, so guess that first.

He also had a little dig at Tomas Kalibera’s work, saying that CXXR has managed to eliminate almost all the PROTECT macros in its codebase.

Radford Neal talked about some optimizations in his pqR project, which uses both interpreted and byte-compiled code.

In interpreted code, pqR uses a “variant result” mechanism, which sounded similar to Renjin’s “deferred execution”.

A performance boost comes from having a fast interface to unary primitives. This also makes eval faster. Another boost comes fro ma smarter way to not look for variables in certain frames. For example, a list of which frames contain overrides for special symbols (+, [, if, etc.) is maintained, so calling them is faster.

Matt Dowle (“the data.table guy”) of H2O gave a nice demo of H2O Flow, a slick web-based GUI for machine learning on big datasets. It does lots of things in parallel, and is scriptable.

Indrajit Roy of HP Labs and Michael Lawrence of Genentech gave a talk on distributed data structures. These seem very good for cases where you need to access your data from multiple machines.

The SparkR package gives access to distributed data structures with a Spark backend, however Indrajit wasn’t keen, saying that it is too low-level to be easy to work with.

Instead he and Michael have developed the dds package that gives a standard interface for using distributed data structures. The package lies on top of Spark.dds and distributedR.dds. The analogy is with DBI providing a stanrdard database interface that uses RSQLite or RPostgreSQL underneath.

Ryan Hafen of Tessera talked about their product (I think also called Tessara) for analysing large datasets. It’s a fancy wrapper to MapReduce that also has distributed data objects. I didn’t get chance to ask if they support the dds interface. The R packages of interest are datadr and trelliscope.

My own talk was less technical than the others today. It consisted of a series of rants about things I don’t like about R, and how to fix them. The topics included how to remove quirks from the R language (please deprecate indexing with factors), helping new users (let the R community create some vignettes to go in base-R), and how to improve CRAN (CRAN is not a code hosting service, CRAN is a shop for packages). I don’t know if any of my suggestions will be taken up, but my last slide seemed to generate some empathy.

I’ve named my CRAN submission process “The Workflow of Infinite Shame”. What tends to happen is that I check that things work on my machine, submit to CRAN, and about an hour later get a response saying “we see these errors, please fix”. Quite often, especially for things involving locales or writing files, I cannot reproduce the issue, so I fiddle about a bit and guess, then resubmit. After five or six iterations, I’ve lost all sense of dignity, and while R-core are very patient, I’m sure they assume that I’m an idiot.

CRAN currently includes a Win-builder service that lets you submit packages, builds them under Windows, then tells you the results. What I want is an everything-builder service that builds and checks my package on all the necessary platforms (Windows, OS X, Linux, BSD, Solaris on R-release, R-patched, and R-devel), and only if it passes does a member of R-core get to see the problem. That way, R-core’s time isn’t wasted, and more importantly I look like less of an idiot.

A flow diagram of CRAN submission steps with an infinite loop

The workflow of infinite shame encapsulates my CRAN submission process.

Tagged: r, r-summit

To leave a comment for the author, please follow the link and comment on his blog: 4D Pie Charts » R.

R-bloggers.com offers daily e-mail updates about R news and tutorials on topics such as: visualization (ggplot2, Boxplots, maps, animation), programming (RStudio, Sweave, LaTeX, SQL, Eclipse, git, hadoop, Web Scraping) statistics (regression, PCA, time series, trading) and more...

RStudio and GitHub

$
0
0

(This article was first published on DataSurg » R, and kindly contributed to R-bloggers)

Version control has become essential for me keeping track of projects, as well as collaborating. It allows backup of scripts and easy collaboration on complex projects. RStudio works really well with Git, an open source open source distributed version control system, and GitHub, a web-based Git repository hosting service. I was always forget how to set up a repository, so here’s a reminder.

This example is done on RStudio Server, but the same procedure can be used for RStudio desktop. Git or similar needs to be installed first, which is straight forward to do.

Setup Git on RStudio and Associate with GitHub

In RStudio, Tools -> Version Control, select Git.

In RStudio, Tools -> Global Options, select Git//SVN tab. Ensure the path to the Git executable is correct. This is particularly important in Windows where it may not default correctly (e.g. C:/Program Files (x86)/Git/bin/git.exe).
1Now hit, Create RSA Key …

2_rsaClose this window.

Click, View public key, and copy the displayed public key.

4_rsaIf you haven’t already, create a GitHub account. Open your account settings and click the SSH keys tab. Click Add SSH key. Paste in the public key you have copied from RStudio.

6_add_keyTell Git who you are. Remember Git is a piece of software running on your own computer. This is distinct to GitHub, which is the repository website. In RStudio, click Tools -> Shell … . Enter:

git config --global user.email "mail@ewenharrison.com"
git config --global user.name "ewenharrison"

Use your GitHub username.

10_who_are_you

Create New project AND git

In RStudio, click New project as normal. Click New Directory.

7_new_project

Name the project and check Create a git repository.

8_new_project_with_git

Now in RStudio, create a new script which you will add to your repository.

9_test_scriptAfter saving your new script (test.R), it should appear in the Git tab on the Environment / history panel.

11_initial_commitClick the file you wish to add, and the status should turn to a green ‘A’. Now click Commit and enter an identifying message in Commit message.

12_inital_commit2You have now committed the current version of this file to your repository on your computer/server. In the future you may wish to create branches to organise your work and help when collaborating.

Now you want to push the contents of this commit to GitHub, so it is also backed-up off site and available to collaborators. In GitHub, create a New repository, called here test.

5_create_git In RStudio, again click Tools -> Shell … . Enter:

git remote add origin https://github.com/ewenharrison/test.git
git config remote.origin.url git@github.com:ewenharrison/test.git
git pull -u origin master
git push -u origin master

13_push_pullYou have now pushed your commit to GitHub, and should be able to see your files in your GitHub account. The Pull Push buttons in RStudio will now also work. Remember, after each Commit, you have to Push to GitHub, this doesn’t happen automatically.

Clone an existing GitHub project to new RStudio project

In RStudio, click New project as normal. Click Version Control.

7_new_projectIn Clone Git Repository, enter the GitHub repository URL as per below. Change the project directory name if necessary.

14_new_version_controlIn RStudio, again click Tools -> Shell … . Enter:

git config remote.origin.url git@github.com:ewenharrison/test.git

Interested in international trials? Take part in GlobalSurg.

To leave a comment for the author, please follow the link and comment on his blog: DataSurg » R.

R-bloggers.com offers daily e-mail updates about R news and tutorials on topics such as: visualization (ggplot2, Boxplots, maps, animation), programming (RStudio, Sweave, LaTeX, SQL, Eclipse, git, hadoop, Web Scraping) statistics (regression, PCA, time series, trading) and more...

What (Really) is a Data Scientist?

$
0
0

(This article was first published on Quality and Innovation » R, and kindly contributed to R-bloggers)
Drew Conway's very popular Data Science Venn Diagram. From http://drewconway.com/zia/2013/3/26/the-data-science-venn-diagram

Drew Conway’s very popular Data Science Venn Diagram. From http://drewconway.com/zia/2013/3/26/the-data-science-venn-diagram

What is a data scientist? What makes for a good (or great!) data scientist? It’s been challenging enough to determine what a data scientist really is (several people have proposed ways to look at this). The Guardian (a UK publication) said, however, that a true data scientist is as “rare as a unicorn”.

I believe that the data scientist “unicorn” is hidden right in front of our faces; the purpose of this post is to help you find it. First, we’ll take a look at some models, and then I’ll present my version of what a data scientist is (and how this person can become “great”).

#1 Drew Conway’s popularData Science Venn Diagram” — created in 2010 — characterizes the data scientist as a person with some combination of skills and expertise in three categories (and preferably, depth in all of them): 1) Hacking, 2) Math and Statistics, and 3) Substantive Expertise (also called “domain knowledge”). 

Later, he added that there was a critical missing element in the diagram: that effective storytelling with data is fundamental. The real value-add, he says, is being able to construct actionable knowledge that facilitates effective decision making. How to get the “actionable” part? Be able to communicate well with the people who have the responsibility and authority to act.

“To me, data plus math and statistics only gets you machine learning, which is great if that is what you are interested in, but not if you are doing data science. Science is about discovery and building knowledge, which requires some motivating questions about the world and hypotheses that can be brought to data and tested with statistical methods. On the flip-side, substantive expertise plus math and statistics knowledge is where most traditional researcher falls. Doctoral level researchers spend most of their time acquiring expertise in these areas, but very little time learning about technology. Part of this is the culture of academia, which does not reward researchers for understanding technology. That said, I have met many young academics and graduate students that are eager to bucking that tradition.”Drew Conway, March 26, 2013

#2 In 2013, Harlan Harris (along with his two colleagues, Sean Patrick Murphy and Marck Vaisman) published a fantastic study where they surveyed approximately 250 professionals who self-identified with the “data science” label. Each person was asked to rank their proficiency in each of 22 skills (for example, Back-End Programming, Machine Learning, and Unstructured Data). Using clustering, they identified four distinct “personality types” among data scientists:

As a manager, you might try to cut corners by hiring all Data Creatives(*). But then, you won’t benefit from the ultra-awareness that theorists provide. They can help you avoid choosing techniques that are inappropriate, if (say) your data violates the assumptions of the methods. This is a big deal! You can generate completely bogus conclusions by using the wrong tool for the job. You would not benefit from the stress relief that the Data Developers will provide to the rest of the data science team. You would not benefit from the deep domain knowledge that the Data Businessperson can provide… that critical tacit and explicit knowledge that can save you from making a potentially disastrous decision.

Although most analysts and researchers who do screw up very innocently screw up their analyses by stumbling into misuses of statistical techniques, some unscrupulous folks might mislead other on purpose; although an extreme case, see I Fooled Millions Into Thinking Chocolate Helps Weight Loss.

Their complete results are available as a 30-page report (available in print or on Kindle).

#3 The Guardian is, in my opinion, a little more rooted in realistic expectations:

“The data scientist’s skills – advanced analytics, data integration, software development, creativity, good communications skills and business acumen – often already exist in an organisation. Just not in a single person… likely to be spread over different roles, such as statisticians, bio-chemists, programmers, computer scientists and business analysts. And they’re easier to find and hire than data scientists.”

They cite British Airways as an exemplar:

“[British Airways] believes that data scientists are more effective and bring more value to the business when they work within teams. Innovation has usually been found to occur within team environments where there are multiple skills, rather than because someone working in isolation has a brilliant idea, as often portrayed in TV dramas.”

Their position is you can’t get all those skills in one person, so don’t look for it. Just yesterday I realized that if I learn one new amazing thing in R every single day of my life, by the time I die, I will probably be an expert in about 2% of the package (assuming it’s still around).

#4 Others have chimed in on this question and provided outlines of skill sets, such as:

  • Six Qualities of a Great Data Scientist: statistical thinking, technical acumen, multi-modal communication skills, curiosity, creativity, grit
  • The Udacity blog: basic tools (R, Python), software engineering, statistics, machine learning, multivariate calculus, linear algebra, data munging, data visualization and communication, and the ultimately nebulous “thinking like a data scientist”
  • IBM: “part analyst, part artist” skilled in “computer science and applications, modeling, statistics, analytics and math… [and] strong business acumen, coupled with the ability to communicate findings to both business and IT leaders in a way that can influence how an organization approaches a business challenge.”
  • SAS: “a new breed of analytical data expert who have the technical skills to solve complex problems – and the curiosity to explore what problems need to be solved. They’re part mathematician, part computer scientist and part trend-spotter.” (Doesn’t that sound exciting?)
  • DataJobs.Com: well, these guys just took Drew Conway’s Venn diagram and relabeled it.

#5 My Answer to “What is a Data Scientist?”:  A data scientist is a sociotechnical boundary spanner who helps convert data and information into actionable knowledge.

Based on all of the perspectives above, I’d like to add that the data scientist must have an awareness of the context of the problems being solved: social, cultural, economic, political, and technological. Who are the stakeholders? What’s important to them? How are they likely to respond to the actions we take in response to the new knowledge data science brings our way? What’s best for everyone involved so that we can achieve sustainability and the effective use of our resources? And what’s with the word “helps” in the definition above? This is intended to reflect that in my opinion, a single person can’t address the needs of a complex data science challenge. We need each other to be “great” at it.

A data scientist is someone who can effectively span the boundaries between

1) understanding social+ context, 

2) correctly selecting and applying techniques from math and statistics,

3) leveraging hacking skills wherever necessary,

4) applying domain knowledge, and

5) creating compelling and actionable stories and connections that help decision-makers achieve their goals. This person has a depth of knowledge and technical expertise in at least one of these five areas, and a high level of familiarity with each of the other areas (commensurate with Harris’ T-model). They are able to work productively within a small team whose deep skills span all five areas.

It’s data-driven decision making embedded in a rich social, cultural, economic, political, and technological context… where the challenges may be complex, and the stakes (and ultimately, the benefits) may be high. 


(*) Disclosure: I am a Data Creative!

(**)Quality professionals (like Six Sigma Black Belts) have been doing this for decades. How can we enhance, expand, and leverage our skills to address the growing need for data scientists?

To leave a comment for the author, please follow the link and comment on his blog: Quality and Innovation » R.

R-bloggers.com offers daily e-mail updates about R news and tutorials on topics such as: visualization (ggplot2, Boxplots, maps, animation), programming (RStudio, Sweave, LaTeX, SQL, Eclipse, git, hadoop, Web Scraping) statistics (regression, PCA, time series, trading) and more...

ChainLadder 0.2.1 released

$
0
0

(This article was first published on mages' blog, and kindly contributed to R-bloggers)

Over the weekend we released version 0.2.1 of the ChainLadder package for claims reserving on CRAN.

New Features

Output of plot(MackChainLadder(MW2014, est.sigma="Mack"), which=3:6)

Changes

  • Updated NAMESPACE file to comply with new R CMD checks in R-3.3.0
  • Removed package dependencies on grDevices and Hmisc
  • Expanded package vignette with new paragraph on importing spreadsheet data, a new section “Paid-Incurred Chain Model” and an added example for a full claims development picture in the “One Year Claims Development Result” section, see also [1] .

Binary versions of the package will appear on the various CRAN mirrors over the next couple of days. Alternatively you can install ChainLadder directly from GitHub using the following R commands:

install.packages(c(“systemfit”, “actuar", "statmod", "tweedie", "devtools"))
library(devtools)
install_github("mages/ChainLadder")
library(ChainLadder)

Completely new to ChainLadder? Start with the package vignette.

References

[1] Claims run-off uncertainty: the full picture. (with M. Merz) SSRN Manuscript, ID 2524352, 2014.

To leave a comment for the author, please follow the link and comment on his blog: mages' blog.

R-bloggers.com offers daily e-mail updates about R news and tutorials on topics such as: visualization (ggplot2, Boxplots, maps, animation), programming (RStudio, Sweave, LaTeX, SQL, Eclipse, git, hadoop, Web Scraping) statistics (regression, PCA, time series, trading) and more...

R 101 – Aggregate By Quarter

$
0
0

(This article was first published on Data Driven Security, and kindly contributed to R-bloggers)

We were asked a question on how to (in R) aggregate quarterly data from what I believe was a daily time series. This is a pretty common task and there are many ways to do this in R, but we’ll focus on one method using the zoo and dplyr packages. Let’t get those imports out of the way:

library(dplyr)
library(zoo)
library(ggplot2)

Now, we need some data. This could be from a database, log file or even Excel spreadsheet or CSV. Since we’re focusing on the aggregation and not the parsing, let’s generate some data, for daily failed logins in calendar year 2014:

set.seed(1492)

yr_2014 <- seq(from=as.Date("2014-01-01"), 
                              to=as.Date("2014-12-31"), 
                              by="day")

logins <- data_frame(date=yr_2014,
                     failures=round(rlnorm(length(yr_2014)) * 
                                      sample(10:50, 1)), 0.5, 3)

glimpse(logins)

## Observations: 365
## Variables:
## $ date     (date) 2014-01-01, 2014-01-02, 2014-01-03, 2014-01-04, 2014...
## $ failures (dbl) 18, 13, 6, 91, 24, 46, 14, 34, 10, 48, 45, 11, 8, 40,...
## $ 0.5      (dbl) 0.5, 0.5, 0.5, 0.5, 0.5, 0.5, 0.5, 0.5, 0.5, 0.5, 0.5...
## $ 3        (dbl) 3, 3, 3, 3, 3, 3, 3, 3, 3, 3, 3, 3, 3, 3, 3, 3, 3, 3,...

Using set.seed makes the pseudo-random draws via rlnorm repeatable on other systems. We can get a better look at that data:

ggplot(logins, aes(x=date, y=failures)) + 
  geom_bar(stat="identity") +
  labs(x=NULL, y="# Login Failuresn") +
  theme_bw() +
  theme(panel.grid=element_blank()) +
  theme(panel.border=element_blank())

We can then, summarize the number of failed logins by quarter using as.yearqtr:

logins %>% 
  mutate(qtr=as.yearqtr(date)) %>% 
  count(qtr, wt=failures) -> total_failed_logins_by_qtr

total_failed_logins_by_qtr

## Source: local data frame [4 x 2]
## 
##       qtr    n
## 1 2014 Q1 4091
## 2 2014 Q2 5915
## 3 2014 Q3 6141
## 4 2014 Q4 5229

NOTE: you can control the way those quarter labels look with the format parater to as.yearqtr:

format

character string specifying format. "%C", "%Y", "%y" and "%q", if present, are replaced with the century, year, last two digits of the year, and quarter (i.e. a number between 1 and 4), respectively.

But you can also get more intra-quarter detail as well by looking at the distribution of failed logins:

logins %>% 
  mutate(qtr=as.character(as.yearqtr(date))) %>% 
  ggplot() +
  geom_violin(aes(x=qtr, y=failures), fill="#cab2d6") +
  geom_boxplot(aes(x=qtr, y=failures), alpha=0) +
  scale_y_continuous(expand=c(0, 0)) +
  labs(x=NULL, y=NULL, title="nDistribution of login failures per quarter") +
  coord_flip() +
  theme_bw() +
  theme(panel.grid=element_blank()) +
  theme(panel.border=element_blank()) +
  theme(axis.ticks.y=element_blank())

To leave a comment for the author, please follow the link and comment on his blog: Data Driven Security.

R-bloggers.com offers daily e-mail updates about R news and tutorials on topics such as: visualization (ggplot2, Boxplots, maps, animation), programming (RStudio, Sweave, LaTeX, SQL, Eclipse, git, hadoop, Web Scraping) statistics (regression, PCA, time series, trading) and more...

Easy Bayesian Bootstrap in R

$
0
0

(This article was first published on Publishable Stuff, and kindly contributed to R-bloggers)


A while back I wrote about how the classical non-parametric bootstrap can be seen as a special case of the Bayesian bootstrap. Well, one difference between the two methods is that, while it is straightforward to roll a classical bootstrap in R, there is no easy way to do a Bayesian bootstrap. This post, in an attempt to change that, introduces a bayes_boot function that should make it pretty easy to do the Bayesian bootstrap for any statistic in R. If you just want a function you can copy-n-paste into R go to The bayes_boot function below. Otherwise here is a quick example of how to use the function, followed by some details on the implementation.

A quick example

So say you scraped the heights of all the U.S. Presidents off Wikipedia (american_presidents.csv) and you want to run a Bayesian bootstrap analysis on the mean height of U.S. Presidents (don’t ask me why you would want to do this). Then, using the bayes_boot function found below, you can run the following:

presidents <- read.csv("american_presidents.csv")
bb_mean <- bayes_boot(presidents$height_cm, mean, n1 = 1000)

Here is how to get a 95% credible interval:

quantile(bb_mean, c(0.025, 0.975))

##  2.5% 97.5% 
## 177.8 181.8

And, of course, we can also plot this:

(Here, and below, I will save you from the slightly messy plotting code, but if you really want to see it you can check out the full script here.)

Now, say we want run a linear regression on presidential heights over time, and we want to use the Bayesian bootstrap to gauge the uncertainty in the regression coefficients. Then we will have to do a little more work, as the second argument to bayes_boot should be a function that takes the data as the first argument and that returns a vector of parameters/coefficients:

bb_linreg <- bayes_boot(presidents, function(data) {
  lm(height_cm ~ order, data)$coef
}, n1 = 1000)

Ok, so it is not really over time, as we use the order of the president as the predictor variable, but close enough. Again, we can get a 95% credible interval of the slope:

quantile(bb_linreg$order, c(0.025, 0.975))

##    2.5%   97.5% 
## 0.03979 0.34973

And here is a plot showing the mean posterior regression line with a smatter of lines drawn from the posterior to visualize the uncertainty:

Given the model and the data, the average height of American presidents increases by around 0.2 cm for each president elected to office. So, either we have that around the 130th president the average height of presidents will be around 2 meters (≈ 6’7’’), or perhaps a linear regression isn’t really a reasonable model here… Anyhow, it was easy to do the Bayesian bootstrap! :)

How to implement a Bayesian bootstrap in R

It is possible to characterize the statistical model underlying the Bayesian bootstrap in a couple of different ways, but all can be implemented by the same computational procedure:

To generate a Bayesian bootstrap sample of size n1, repeat the following n1 times:

  1. Draw weights from a uniform Dirichlet distribution with the same dimension as the number of data points.
  2. Calculate the statistic, using the Dirichlet draw to weight the data, and record it.

1. Drawing weights from a uniform Dirichlet distribution

One way to characterize drawing from an n-dimensional uniform Dirichlet distribution is as drawing a vector of length n where the values are positive, sum to 1.0, and where any combination of values is equally likely. Another way to characterize a uniform Dirichlet distribution is as a uniform distribution over the unit simplex, where a unit simplex is a generalization of a triangle to higher dimensions, with sides that are 1.0 long (hence the unit). The figure below pictures the one, two, three and four-dimensional unit simplex:


Image source: Introduction to Discrete Differential Geometry by Peter Schröder

Drawing from an n-dimensional uniform Dirichlet distribution can be done by drawing $text{Gamma(1,1)}$ distributed numbers and normalizing these to sum to 1.0 (source). As a $text{Gamma(1,1)}$ distribution is the same as an $text{Exponential}(1)$ distribution, the following two lines of R code implements drawing n1 draws from an n dimensional uniform Dirichlet distribution:

dirichlet_sample <- matrix( rexp(n * n1, 1) , ncol = n, byrow = TRUE)
dirichlet_sample <- dirichlet_sample / rowSums(dirichlet_sample)

With n <- 4 and n1 <- 3 you could, for example, get:

##         [,1]    [,2]   [,3]    [,4]
## [1,] 0.61602 0.06459 0.2297 0.08973
## [2,] 0.05384 0.12774 0.4685 0.34997
## [3,] 0.17419 0.42458 0.1649 0.23638

2. Calculate the statistic using a Dirichlet draw to weight the data

Here is where, if you were doing a classical non-parametric bootstrap, you would use your resampled data to calculate a statistic (say a mean). Instead, we will want to calculate our statistic of choice using the Dirichlet draw to weight the data. This is completely straightforward if the statistic can be calculated using weighted data, which is the case for weighted.mean(x, w) and lm(..., weights). For the many statistics that do not accept weights, such as median and cor, we will have to perform a second sampling step where we (1) sample from the data according to the probabilities defined by the Dirichlet weights, and (2) use this resampled data to calculate the statistic. It is important to notice that we here want to draw an as large sample as possible from the data, and not a sample of the same size as the original data. The point is that the proportion of times a datapoint occurs in this resampled dataset should be roughly proportional to that datapoint’s weight.

Note that doing this second resampling step won’t work if the statistic changes with the sample size! An example of such a statistic would be the sample standard deviation (sd), population standard deviation would be fine, however

Bringing it all together

Below is a small example script that takes the presidents dataset and does a Bayesian Bootstrap analysis of the median height. Here n1 is the number of bootstrap draws and n2 is the size of the resampled data used to calculate the median for each Dirichlet draw.

n1 <- 3000
n2 <- 1000
n_data <- nrow(presidents)
# Generating a n1 by n_data matrix where each row is an n_data dimensional
# Dirichlet draw.
weights <- matrix( rexp(n_data * n1, 1) , ncol = n_data, byrow = TRUE)
weights <- weights / rowSums(weights)

bb_median <- rep(NA, n1)
for(i in 1:n1) {
  data_sample <- sample(presidents$height_cm, size = n2, replace = TRUE, prob = weights[i,])
  bb_median[i] <- median(data_sample)
}

# Now bb_median represents the posterior median height, and we can do all
# the usual stuff, like calculating a 95% credible interval.
quantile(bb_median, c(0.025, 0.975))

##  2.5% 97.5% 
##   178   183

If we were interested in the mean instead, we could skip resampling the data and use the weights directly, like this:

bb_mean <- rep(NA, n1)
for(i in 1:n1) {
  bb_mean[i] <- weighted.mean(presidents$height_cm, w = weights[i,])
}
quantile(bb_mean, c(0.025, 0.975))

##  2.5% 97.5% 
## 177.8 181.9

If possible, you will probably want to use the weight method; it will be much faster as you skip the costly resampling step. What size of the bootstrap samples (n1) and size of the resampled data (n2) to use? The boring answers are: “As many as you can afford” and “Depends on the situation”, but you’ll probably want at least 1000 of each.

The bayes_boot function

Here follows a handy function for running a Bayesian bootstrap that you can copy-n-paste directly into your R-script. It should accept any type of data that comes as a vector, matrix or data.frame and allows you to use both statistics that can deal with weighted data (like weighted.mean) and statistics that don’t (like median). See above and below for examples of how to use it.

Caveat: While I have tested this function for bugs, do keep an eye open and tell me if you find any. Again, note that doing the second resampling step (use_weights = FALSE) won’t work if the statistic changes with the sample size!

# Performs a Bayesian bootstrap and returns a sample of size n1 representing the
# posterior distribution of the statistic. Returns a vector if the statistic is
# one-dimensional (like for mean(...)) or a data.frame if the statistic is
# multi-dimensional (like for the coefs. of lm).
# Parameters
#   data      The data as either a vector, matrix or data.frame.
#   statistic A function that accepts data as its first argument and possibly
#             the weights as its second, if use_weights is TRUE. 
#             Should return a numeric vector.
#   n1        The size of the bootstrap sample.
#   n2        The sample size used to calculate the statistic each bootstrap draw.
#   use_weights  Whether the statistic function accepts a weight argument or
#                should be calculated using resampled data.
#   weight_arg   If the statistic function includes a named argument for the
#                weights this could be specified here.
#   ...       Further arguments passed on to the statistic function.
bayes_boot <- function(data, statistic, n1 = 1000, n2 = 1000 , use_weights = FALSE, weight_arg = NULL, ...) {
  # Draw from a uniform Dirichlet dist. with alpha set to rep(1, n_dim).
  # Using the facts that you can transform gamma distributed draws into 
  # Dirichlet draws and that rgamma(n, 1) <=> rexp(n, 1)
  dirichlet_weights <- matrix( rexp(NROW(data) * n1, 1) , ncol = NROW(data), byrow = TRUE)
  dirichlet_weights <- dirichlet_weights / rowSums(dirichlet_weights)

  if(use_weights) {
    stat_call <- quote(statistic(data, w, ...))
    names(stat_call)[3] <- weight_arg
    boot_sample <- apply(dirichlet_weights, 1, function(w) {
      eval(stat_call)
    })
  } else {
    if(is.null(dim(data)) || length(dim(data)) < 2) { # data is a list type of object
      boot_sample <- apply(dirichlet_weights, 1, function(w) {
        data_sample <- sample(data, size = n2, replace = TRUE, prob = w)
        statistic(data_sample, ...)
      })
    } else { # data is a table type of object
      boot_sample <- apply(dirichlet_weights, 1, function(w) {
        index_sample <- sample(nrow(data), size = n2, replace = TRUE, prob = w)
        statistic(data[index_sample, ,drop = FALSE], ...)
      })
    }
  }
  if(is.null(dim(boot_sample)) || length(dim(boot_sample)) < 2) {
    # If the bootstrap sample is just a simple vector return it.
    boot_sample
  } else {
    # Otherwise it is a matrix. Since apply returns one row per statistic
    # let's transpose it and return it as a data frame.
    as.data.frame(t(boot_sample))
  }
}

More examples using bayes_boot

Let’s start by drawing some fake data from an exponential distribution with mean 1.0 and compare using the following methods to infer the mean:

  • The classical non-parametric bootstrap using boot from the boot package.
  • Using bayes_boot with “two level sampling”, that is, sampling both weights and then resampling the data according to those weights.
  • Using bayes_boot with weights (use_weights = TRUE)
  • Assuming an exponential distribution (the “correct” distribution since we know where the data came from), with a flat prior over the mean.

First generating some data:

set.seed(1337)
exp_data <- rexp(8, rate = 1)
exp_data

## [1] 0.15 0.13 2.26 0.92 0.17 1.55 0.13 0.02

Then running the four different methods:

library(boot)
b_classic <- boot(exp_data, function(x, i) { mean(x[i])}, R = 10000)
bb_sample <- bayes_boot(exp_data, mean, n1 = 10000, n2 = 1000)
bb_weight <- bayes_boot(exp_data, weighted.mean, n1 = 10000, use.weights = TRUE, weight_arg = "w")

# Just a hack to sample from the posterior distribution when 
# assuming an exponential distribution with a Uniform(0, 10) prior
prior <- seq(0.001, 10, 0.001)
post_prob <- sapply(prior, function(mean) { prod(dexp(exp_data, 1/mean)) })
post_samp <- sample(prior, size = 10000, replace = TRUE, prob = post_prob)

Here are the resulting posterior/sampling distributions:

This was mostly to show off the syntax of bayes_boot, but some things to point out in the histograms above are that:

  • Using the Bayesian bootstrap with two level sampling or weights result in very similar posterior distributions, which should be the case when the size of the resampled data is large (here set to n2 = 1000).
  • The classical non-parametric bootstrap is pretty similar to the Bayesian bootstrap (as we would expect).
  • The bootstrap distributions are somewhat similar to the posterior mean assuming an exponential distribution, but completely misses out on the uncertainty in the right tail. This is due to the “somewhat peculiar model assumptions” of the bootstrap as critiqued by Rubin (1981)

Finally, a slightly more complicated example, where we do Bayesian bootstrap analysis of LOESS regression applied to the cars dataset on the speed of cars and the resulting distance it takes to stop. The loess function returns, among other things, a vector of fitted y values, one value for each x value in the data. These y values define the smoothed LOESS line and is what you would usually plot after having fitted a LOESS. Now we want to use the Bayesian bootstrap to gauge the uncertainty in the LOESS line. As the loess function accepts weighted data, we’ll simply create a function that takes the data with weights and returns the fitted y values. We’ll then plug that function into bayes_boot:

boot_fn <- function(cars, weights) {
  loess(dist ~ speed, cars, weights = weights)$fitted
}

bb_loess <- bayes_boot(cars, boot_fn, n1 = 1000, use_weights = TRUE, weight_arg = "weights")

To plot this takes a couple of lines more:

# Plotting the data
plot(cars$speed, cars$dist, pch = 20, col = "tomato4", xlab = "Car speed in mph",
     ylab = "Stopping distance in ft", main = "Speed and Stopping distances of Cars")

# Plotting a scatter of Bootstrapped LOESS lines to represent the uncertainty.
for(i in sample(nrow(bb_loess), 20)) {
  lines(cars$speed, bb_loess[i,], col = "gray")
}
# Finally plotting the posterior mean LOESS line
lines(cars$speed, colMeans(bb_loess, na.rm = TRUE), type ="l",
      col = "tomato", lwd = 4)

Fun fact: The cars dataset is from the 20s! Which explains why the fastest car travels at 25 mph. It would be interesting to see a comparison with stopping times for modern cars!

References

Rubin, D. B. (1981). The Bayesian Bootstrap. The annals of statistics, 9(1), 130-134. pdf

To leave a comment for the author, please follow the link and comment on his blog: Publishable Stuff.

R-bloggers.com offers daily e-mail updates about R news and tutorials on topics such as: visualization (ggplot2, Boxplots, maps, animation), programming (RStudio, Sweave, LaTeX, SQL, Eclipse, git, hadoop, Web Scraping) statistics (regression, PCA, time series, trading) and more...

Leave the Pima Indians alone!

$
0
0

(This article was first published on Xi'an's Og » R, and kindly contributed to R-bloggers)

“…our findings shall lead to us be critical of certain current practices. Specifically, most papers seem content with comparing some new algorithm with Gibbs sampling, on a few small datasets, such as the well-known Pima Indians diabetes dataset (8 covariates). But we shall see that, for such datasets, approaches that are even more basic than Gibbs sampling are actually hard to beat. In other words, datasets considered in the literature may be too toy-like to be used as a relevant benchmark. On the other hand, if ones considers larger datasets (with say 100 covariates), then not so many approaches seem to remain competitive” (p.1)

Nicolas Chopin and James Ridgway (CREST, Paris) completed and arXived a paper they had “threatened” to publish for a while now, namely why using the Pima Indian R logistic or probit regression benchmark for checking a computational algorithm is not such a great idea! Given that I am definitely guilty of such a sin (in papers not reported in the survey), I was quite eager to read the reasons why! Beyond the debate on the worth of such a benchmark, the paper considers a wider perspective as to how Bayesian computation algorithms should be compared, including the murky waters of CPU time versus designer or programmer time. Which plays against most MCMC sampler.

As a first entry, Nicolas and James point out that the MAP can be derived by standard a Newton-Raphson algorithm when the prior is Gaussian, and even when the prior is Cauchy as it seems most datasets allow for Newton-Raphson convergence. As well as the Hessian. We actually took advantage of this property in our comparison of evidence approximations published in the Festschrift for Jim Berger. Where we also noticed the awesome performances of an importance sampler based on the Gaussian or Laplace approximation. The authors call this proposal their gold standard. Because they also find it hard to beat. They also pursue this approximation to its logical (?) end by proposing an evidence approximation based on the above and Chib’s formula. Two close approximations are provided by INLA for posterior marginals and by a Laplace-EM for a Cauchy prior. Unsurprisingly, the expectation-propagation (EP) approach is also implemented. What EP lacks in theoretical backup, it seems to recover in sheer precision (in the examples analysed in the paper). And unsurprisingly as well the paper includes a randomised quasi-Monte Carlo version of the Gaussian importance sampler. (The authors report that “the improvement brought by RQMC varies strongly across datasets” without elaborating for the reasons behind this variability. They also do not report the CPU time of the IS-QMC, maybe identical to the one for the regular importance sampling.) Maybe more surprising is the absence of a nested sampling version.

pimcisIn the Markov chain Monte Carlo solutions, Nicolas and James compare Gibbs, Metropolis-Hastings, Hamiltonian Monte Carlo, and NUTS. Plus a tempering SMC, All of which are outperformed by importance sampling for small enough datasets. But get back to competing grounds for large enough ones, since importance sampling then fails.

“…let’s all refrain from now on from using datasets and models that are too simple to serve as a reasonable benchmark.” (p.25)

This is a very nice survey on the theme of binary data (more than on the comparison of algorithms in that the authors do not really take into account design and complexity, but resort to MSEs versus CPus). I however do not agree with their overall message to leave the Pima Indians alone. Or at least not for the reason provided therein, namely that faster and more accurate approximations methods are available and cannot be beaten. Benchmarks always have the limitation of “what you get is what you see”, i.e., the output associated with a single dataset that only has that many idiosyncrasies. Plus, the closeness to a perfect normal posterior makes the logistic posterior too regular to pause a real challenge (even though MCMC algorithms are as usual slower than iid sampling). But having faster and more precise resolutions should on the opposite be  cause for cheers, as this provides a reference value, a golden standard, to check against. In a sense, for every Monte Carlo method, there is a much better answer, namely the exact value of the integral or of the optimum! And one is hardly aiming at a more precise inference for the benchmark itself: those Pima Indians [whose actual name is Akimel O’odham] with diabetes involved in the original study are definitely beyond help from statisticians and the model is unlikely to carry out to current populations. When the goal is to compare methods, as in our 2009 paper for Jim Berger’s 60th birthday, what matters is relative speed and relative ease of implementation (besides the obvious convergence to the proper target). In that sense bigger and larger is not always relevant. Unless one tackles really big or really large datasets, for which there is neither benchmark method nor reference value.

Filed under: Books, R, Statistics, University life Tagged: ABC, Akimel O’odham, Bayes factor, benchmark, Chib’s approximation, CPU, diabetes, EP-ABC, expectation-propagation, Gibbs sampling, Jim Berger, logistic regression, MCMC algorithms, Monte Carlo Statistical Methods, Newton-Raphson algorithm, Pima Indians, probit model, R

To leave a comment for the author, please follow the link and comment on his blog: Xi'an's Og » R.

R-bloggers.com offers daily e-mail updates about R news and tutorials on topics such as: visualization (ggplot2, Boxplots, maps, animation), programming (RStudio, Sweave, LaTeX, SQL, Eclipse, git, hadoop, Web Scraping) statistics (regression, PCA, time series, trading) and more...

This R Data Import Tutorial Is Everything You Need

$
0
0

(This article was first published on The DataCamp Blog » R, and kindly contributed to R-bloggers)

You might find that loading data into R can be quite frustrating. Almost every single type of file that you want to get into R seems to require its own function, and even then you might get lost in the functions’ arguments. In short, it can be fairly easy to mix up things from time to time, whether you are a beginner or a more advanced R user…

To cover these needs, DataCamp decided to publish a comprehensive, yet easy tutorial to quickly importing data into R, going from simple text files to the more advanced SPSS and SAS files. Keep on reading to find out how to easily import your files into R!

Matrix_Code

Your Data

To import data into R, you first need to have data. This data can be saved in a file onto your computer (e.g. a local Excel, SPSS, or some other type of file), but can also live on the Internet or be obtained through other sources. Where to find these data are out of the scope of this tutorial, so for now it’s enough to mention this blog post, which explains well how to find data on the internet, and DataCamp’s interactive tutorial, which deals with how to import and manipulate Quandl data sets.

Tip: before you move on and discover how to load your data into R, it might be useful to go over the following checklist that will make it easier to import the data correctly into R:

  • If you work with spreadsheets, the first row is usually reserved for the header, while the first column is used to identify the sampling unit;
  • Avoid names, values or fields with blank spaces, otherwise each word will be interpreted as a separate variable, resulting in errors that are related to the number of elements per line in your data set;
  • If you want to concatenate words, inserting a . in between to words instead of a space;
  • Short names are prefered over longer names;
  • Try to avoid using names that contain symbols such as ?, $,%, ^, &, *, (, ),-,#, ?,,,<,>, /, |, , [ ,] ,{, and };
  • Delete any comments that you have made in your Excel file to avoid extra columns or NA’s to be added to your file; and
  • Make sure that any missing values in your data set are indicated with NA.

Preparing Your R Workspace

Make sure to go into RStudio and see what needs to be done before you start your work there. You might have an environment that is still filled with data and values, which you can all delete using the following line of code:

rm(list=ls())

The rm() function allows you to “remove objects from a specified environment”. In this case, you specify that you want to consider a list for this function, which is the outcome of the ls() function. This last function returns you a vector of character strings that gives the names of the objects in the specified environment. Since this function has no argument, it is assumed that you mean the data sets and functions that you as a user have defined.

Next, you might also find it handy to know where your working directory is set at the moment:

getwd()

And you might consider changing the path that you get as a result of this function, maybe to the folder in which you have stored your data set:

setwd("<location of your dataset>")

Getting Data From Common Sources into R

You will see that the following basic R functions focus on getting spreadsheets into R, rather than Excel or other type of files. If you are more interested in the latter, scroll a bit further to discover the ways of importing other files into R.

Importing TXT files

If you have a .txt or a tab-delimited text file, you can easily import it with the basic R function read.table(). In other words, your file will look similar to this

// Contents of .txt

1   6   a 
2   7   b
3   8   c 
4   9   d
5   10  e

and can be imported as follows:

df <- read.table("<FileName>.txt", 
                 header = FALSE)

Note that by using this function, your data from the file will become a data.frame object. Note also that the first argument isn’t always a filename, but could possibly also be a webpage that contains data. The header argument specifies whether or not you have specified column names in your data file. The final result of your importing will show in the RStudio console as:

  V1 V2 V3
1  1  6  a
2  2  7  b
3  3  8  c
4  4  9  d
5  5 10  e

Good to know
The read.table() function is the most important and commonly used function to import simple data files into R. It is easy and flexible. That is why you should definitely check out our previous tutorial on reading and importing Excel files into R, which explains in great detail how to use the read.table() function optimally.

For files that are not delimited by tabs, like .csv and other delimited files, you actually use variants of this basic function. These variants are almost identical to the read.table() function and differ from it in three aspects only:

  • The separator symbol;
  • The header argument is always set at TRUE, which indicates that the first line of the file being read contains the header with the variable names;
  • The fill argument is also set as TRUE, which means that if rows have unequal length, blank fields will be added implicitly.

Importing CSV Files

If you have a file that separates the values with a , or ;, you usually are dealing with a .csv file. It looks somewhat like this:

// Contents of .csv file

Col1,Col2,Col3
1,2,3
4,5,6
7,8,9
a,b,c

In order to successfully load this file into R, you can use the read.table() function in which you specify the separator character, or you can use the read.csv() or read.csv2() functions. The former function is used if the separator is a ,, the latter if ; is used to separate the values in your data file.

Remember that the read.csv() as well as the read.csv2() function are almost identical to the read.table() function, with the sole difference that they have the header and fill arguments set as TRUE by default.

df <- read.table("<FileName>.csv", 
                 header = FALSE,
                 sep = ",")

df <- read.csv("<FileName>.csv",
               header = FALSE)

df <- read.csv2("<FileName>.csv", 
               header= FALSE)

Tip: if you want to know more about the arguments that you can use in the read.table(), read.csv() or read.csv2() functions, you can always check out our reading and importing Excel files into R tutorial, which explains in great detail how to use the read.table(), read.csv() or read.csv2() functions.

Importing Files With Other Separator Characters

In case you have a file with a separator character that is different from a tab, a comma or a semicolon, you can always use the read.delim() and read.delim2() functions. These are variants of the read.table() function, just like the read.csv() function. Consequently, they have much in common with the read.table() function, except for the fact that they assume that the first line that is being read in is a header with the attribute names, while they use a tab as a separator instead of a whitespace, comma or semicolon. They also have the fill argument set to TRUE, which means that blank field will be added to rows of unequal length.

You can use the read.delim() and read.delim2() functions as follows:

df <- read.delim("<name and extension of your file>") 
df <- read.delim2("<name and extension of your file>")

Importing Excel Files Into R

To load Excel files into R, you first need to do some further prepping of your workspace in the sense that you need to install packages. Simply run the following piece of code to accomplish this:

install.packages("<name of the package>")

When you have installed the package, you can just type in the following to activate it in your workspace:

library("<name of the package>")

To check if you already installed the package or not, type in

any(grepl("<name of your package>", 
          installed.packages()))

Importing Excel Files With The XLConnect Package

The first way to get Excel files directly into R is by using the XLConnect package. Install the package and if you’re not sure whether or not you already have it, check if it is already there.

Next, you can start using the readWorksheetFromFile() function, just like shown here below:

library(XLConnect)
df <- readWorksheetFromFile("<file name and extension>", 
                            sheet = 1)

Note that you need to add the sheet argument to specify which sheet you want to load into R. You can also add more specifications. You can find these explained in our tutorial on reading and importing Excel files into R.

You can also load in a whole workbook with the loadWorkbook() function, to then read in worksheets that you desire to appear as data frames in R through readWorksheet():

wb <- loadWorkbook("<name and extension of your file>")
df <- readWorksheet(wb, 
                    sheet=1) 

Note again that the sheet argument is not the only argument that you can use in readWorkSheetFromFile() . If you want more information about the package or about all the arguments that you can pass to the readWorkSheetFromFile() function or to the two alternative functions that were mentioned, you can visit the package’s RDocumentation page.

Importing Excel Files With The Readxl Package

The readxl package has only recently been published and allows R users to easily read in Excel files, just like this:

library(readxl)
df <- read_excel("<name and extension of your file>")

Note that the first argument specifies the path to your .xls or .xlsx file, which you can set by using the getwd() and setwd() functions. You can also add a sheet argument, just like with the XLConnect package, and many more arguments on which you can read up here or in this blog post.

Importing JavaScript Object Notation (JSON) Files Into R

To get JSON files into R, you first need to install or load the rjson package. If you want to know how to install packages or how to check if packages are already installed, scroll a bit up to the section of importing Excel files into R.

Once you have done this, you can use the fromJSON() function. Here, you have two options:

Your JSON file is stored in your working directory.

library(rjson)
JsonData <- fromJSON(file = "<filename.json>" )

Your JSON file is available through a URL.

library(rjson)
JsonData <- fromJSON(file = "<URL to your JSON file>" )

Importing XML Data Into R

If you want to get XML data into R, one of the easiest ways is through the usage of the XML package. First, you make sure you install and load the XML package in your workspace, just like demonstrated above. Then, you can use the xmlTreeParse() function to parse the XML file directly from the web:

library(XML)
xmlfile <- xmlTreeParse("<Your URL to the XML data>")

Next, you can check whether R knows that xmlfile is in XML by entering:

class(xmlfile) #Result is usually similar to this: [1] "XMLDocument"         "XMLAbstractDocument"

Tip: you can use the xmlRoot() function to access the top node:

topxml <- xmlRoot(xmlfile)

You will see that the data is presented kind of weirdly when you try printing out the xmlfile vector. That is because the XML file is still a real XML document in R at this point. In order to put the data in a data frame, you first need to extract the XML values. You can use the xmlSApply() function to do this:

topxml <- xmlSApply(topxml, 
                    function(x) xmlSApply(x, xmlValue))

The first argument of this function will be topxml, since it is the top node on whose children you want to perform a certain function. Then, you list the function that you want to apply to each child node. In this case, you want to extract the contents of a leaf XML node. This, in combination with the first argument topxml, will make sure that you will do this for each leaf XML node.

Lastly, you put the values in a dataframe! You use the data.frame() function in combination with the matrix transpostition function t() to do this. Additionally you also specify that no row names should be included:

xml_df <- data.frame(t(topxml),
                     row.names=NULL)

You can also choose not to do all the previous steps, which are a bit more complicated, and to just do the following:

url <- "<a URL with XML data>"
data_df <- xmlToDataFrame(url)

Importing Data From HTML Tables Into R

Getting data From HTML tables into R is pretty straightforward:

url <- "<a URL>"
data_df <- readHTMLTable(url, 
                         which=3)

Note that the which argument allows you to specify which tables to return from within the document.

If this gives you an error in the nature of “failed to load external entity”, don’t be confused: this error has been signaled by many people and has been confirmed by the package’s author here. You can work around this by using the RCurl package in combination with the XML package to read in your data:

library(XML)
library(RCurl)

url <- "YourURL"

urldata <- getURL(url)
data <- readHTMLTable(urldata, 
                      stringsAsFactors = FALSE)

Note that you don’t want the strings to be registered as factors or categorical variables! You can also use the httr package to accomplish exactly the same thing, except for the fact that you will want to convert the raw objects of the URL’s content to characters by using the rawToChar argument:

library(httr)

urldata <- GET(url)
data <- readHTMLTable(rawToChar(urldata$content), 
                      stringsAsFactors = FALSE)

Getting Data From Statistical Software Packages into R

For the following more advanced statistical software programs, there are corresponding packages that you first need to install in order to read your data files into R, just like you do with Excel or JSON.

Importing SPSS Files into R

If you’re a user of SPSS software and you are looking to import your SPSS files into R, firstly install the foreign package. After loading the package, run the read.spss() function that is contained within it and you should be good to go!

library(foreign)
mySPSSData <- read.spss("example.sav")

Tip: if you wish the result to be displayed in a data frame, make sure to set the to.data.frame argument of the read.spss() function to TRUE. Furthermore, if you do NOT want the variables with value labels to be converted into R factors with corresponding levels, you should set the use.value.labels argument to FALSE:

library(foreign)
mySPSSData <- read.spss("example.sav",
                       to.data.frame=TRUE,
                       use.value.labels=FALSE)

Remember that factors are variables that can only contain a limited number of different values. As such, they are often called “categorical variables”. The different values of factors can be labeled and are therefore often called “value labels”

Importing Stata Files into R

To import Stata files, you keep on using the foreign package:

library(foreign)
mydata <- read.dta("<Path to file>") 

Importing Systat Files into R

If you want to get Systat files into R, you also want to use the foreign package, just like shown below:

library(foreign)
mydata <- read.systat("<Path to file>") 

Importing SAS Files into R

For those R users that also want to import SAS file into R, it’s very simple! For starters, install the sas7bdat package. Load it, and then invoke the read.sas7bdat() function contained within the package and you are good to go!

library(sas7bdat)
mySASData <- read.sas7bdat("example.sas7bdat")

Does this function interest you and do you want to know more? Visit the Rdocumentation page.

Importing Minitab Files into R

Is your software of choice for statistical purposes Minitab? Look no further if you want to use Minitab data in R!

Importing .mtp files into R is pretty straightforward. To begin with, install the foreign package and load it. Then simply use the read.mtp() function from that package:

library(foreign)
myMTPData <- read.mtp("example2.mtp")

Importing RDA or RData Files into R

If your data file is one that you have saved in R as an .rdata file, you can read it in as follows:

load("<FileName>.RDA")

Getting Data From Other Sources Into R

Since this tutorial focuses on importing data from different types of sources, it is only right to also mention that you can import data into R that comes from databases, webscraping, etc.

Importing Data From Databases

Importing Data From Relational Databases

For more information on getting data from relational databases into R, check out this tutorial for importing data from MonetDB.

If, however, you want to load data from MySQL into R, you can follow this tutorial, which uses the dplyr package to import the data into R.

If you are interested in knowing more about this last package, make sure to check out DataCamp’s interactive course, which is definitely a must for everyone that wants to use dplyr to access data stored outside of R in a database. Furthermore, the course also teaches you how to perform sophisticated data manipulation tasks using dplyr!

Importing Data From Non-Relational Databases

For more information on loading data from non-relational databases into R, like data from MongoDB, you can read this blogpost from “Yet Another Blog in Statistical Computing” for an overview on how to load data from MongoDB into R.

Importing Data Through Webscraping

You can read up on how to scrape JavaScript data with R with the use of PhantomJS and the rvest package in this DataCamp tutorial. If you want to use APIs to import your data, you can easily find one here.

Tip: you can check out this set of amazing tutorials which deal with the basics of webscraping.

Importing Data Through The TM Package

For those of you who are interested in importing textual data to start mining texts, you can read in the text file in the following way after having installed and activated the tm package:

text <- readLines("<filePath>")

Then, you have to make sure that you load these data as a corpus in order to get started correctly:

docs <- Corpus(VectorSource(text))

You can find an accessible tutorial on text mining with R here.

This Is Just The Beginning…

Loading your data into R is just a small step in your exciting data analysis, manipulation and visualization journey. DataCamp is here to guide you through it!

If you are a beginner, make sure to check out our tutorials on machine learning and histograms.

If you are already a more advanced R user, you might be interested in reading our tutorial on 15 Easy Solutions To Your Data Frame Problems In R.

Also, don’t forget to pass by DataCamp to see whether our offer of interactive courses on R can interest you!

facebooktwittergoogle_pluslinkedin

The post This R Data Import Tutorial Is Everything You Need appeared first on The DataCamp Blog .

To leave a comment for the author, please follow the link and comment on his blog: The DataCamp Blog » R.

R-bloggers.com offers daily e-mail updates about R news and tutorials on topics such as: visualization (ggplot2, Boxplots, maps, animation), programming (RStudio, Sweave, LaTeX, SQL, Eclipse, git, hadoop, Web Scraping) statistics (regression, PCA, time series, trading) and more...

A Statistical Analysis of the LearnedLeague Trivia Competition

$
0
0

(This article was first published on Category: R | Todd W. Schneider, and kindly contributed to R-bloggers)

LearnedLeague bills itself as “the greatest web-based trivia league in all of civilized earth.” Having been fortunate enough to partake in the past 3 seasons, I’m inclined to agree.

LearnedLeague players, known as “LLamas”, answer trivia questions drawn from 18 assorted categories, and one of the many neat things about LearnedLeague is that it provides detailed statistics into your performance by category. Personally I was surprised at how quickly my own stats began to paint a startlingly accurate picture of my trivia knowledge: strength in math, business, sports, and geography, coupled with weakness in classical music, art, and literature. Here are my stats through 3 seasons of LearnedLeague play:

stats

My personal category stats through 3 seasons of LearnedLeague. The “Lg%” column represents the average correct % for all LearnedLeague players, who are known colloquially as “LLamas”

It stands to reason that performance in some of these categories should be correlated. For example, people who are good at TV trivia are probably likely to be better than average at movie trivia, so we’d expect a positive correlation between performance in the TV and film categories. It’s harder to guess at what categories might be negatively correlated. Maybe some of the more scholarly pursuits, like art and literature, would be negatively correlated with some of the more, er, plebeian categories like popular music and food/drink?

With the LearnedLeague Commissioner’s approval, I collected aggregate category stats for all recently active LLamas so that I could investigate correlations between category performance and look for other interesting trends. My dataset and code are all available on GitHub, though profile names have been anonymized.

Correlated categories

I analyzed a total of 2,689 players, representing active LLamas who have answered at least 400 total questions. Each player has 19 associated numbers: a correct rate for each of the 18 categories, plus an overall correct rate. For each of the 153 pairs of categories, I calculated the correlation coefficient between player performance in those categories.

The pairs with the highest correlation were:

  1. Geography & World History, ρ = 0.860
  2. Film & Television, ρ = 0.803
  3. American History & World History, ρ = 0.802
  4. Art & Literature, ρ = 0.795
  5. Geography & Language, ρ = 0.773

And the categories with the lowest correlation:

  1. Math & Television, ρ = 0.126
  2. Math & Theatre, ρ = 0.135
  3. Math & Pop Music, ρ = 0.137
  4. Math & Film, ρ = 0.148
  5. Math & Art, ρ = 0.256

The scatterplots of the most and least correlated pairs look as follows. Each dot represents one player, and I’ve added linear regression trendlines:

Most correlated: geography and world history

Geography & World History

Least correlated: math and television

Math & Television

The full list of 153 correlations is available in this Google spreadsheet. At first I was a bit surprised to see that every category pair showed a positive correlation, but upon further reflection it shouldn’t be that surprising: some people are just better at trivia, and they’ll tend to do well in all categories (none other than Ken Jennings himself is an active LLama!).

The most correlated pairs make some intuitive sense, though we should always be wary of hindsight bias. Still, it’s pretty easy to tell believable stories about the highest correlations: people who know a lot about world history probably know where places are (i.e. geography), people who watch TV also watch movies, and so on. I must say, though, that the low correlation between knowledge of math and the pop culture categories of TV, theatre, pop music, and film doesn’t do much to dispel mathematicians’ reclusive images! The only category that math shows an above-average correlation to is science, so perhaps it’s true that mathematicians just live off in their own world?

You can view a scatterplot for any pair of categories by selecting them from the menus below. There’s also a bar graph that ranks the other categories by their correlation to your chosen category:

Turn on javascript (or click through from RSS) to view scatter and batplots for additional categories.

image

image

Predicting gender from trivia category performance

LLamas optionally provide a bit of demographic information, including gender, location, and college(s) attended. It’s not lost on me that my category performance is pretty stereotypically “male.” For better or worse, my top 3 categories—business, math, and sports—are often thought of as male-dominated fields. That got me to wondering: does performance across categories predict gender?

It’s important to note that LearnedLeague members are a highly self-selected bunch, and in no way representative of the population at large. It would be wrong to extrapolate from LearnedLeague results to make a broader statement about how men and women differ in their trivia knowledge. At the same time, predictive analysis can be fun, so I used R’s rpart package to train a recursive partitioning decision tree model which predicts a player’s gender based on category statistics. Recursive partitioning trees are known to have a tendency to overfit data, so I used R’s prune() function to snip off some of the less important splits from the full tree model:

decision tree

The labels on each leaf node report the actual fraction of the predicted gender in that bucket. For example, following from the top of the tree to the right: of the players who got at least 42% of their games/sport questions correct, and less than 66% of their theatre questions correct, 85% were male

The decision tree uses only 4 of the 18 categories available to it: games/sport, theatre, math, and food/drink, suggesting that these are the most important categories for predicting gender. Better performance in games/sport and math makes a player more likely to be male, while better performance in theatre and food/drink makes a player more likely to be female.

How accurate is the decision tree model?

The dataset includes 2,093 males and 595 females, and the model correctly categorizes gender for 2,060 of them, giving an overall accuracy rate of 77%. Note that there are more males in the dataset than there are correct predictions from the model, so in fact the ultra-naive model of “always guess male” would actually achieve a higher overall accuracy rate than the decision tree. However, as noted in this review of decision trees, “such a model would be literally accurate but practically worthless.” In order to avoid this pitfall, I manually assigned prior probabilities of 50% each to male and female. This ensures that the decision tree makes an equal effort to predict male and female genders, rather than spending most of its effort getting all of the males correct, which would maximize the number of total correct predictions.

With the equal priors assigned, the model correctly predicts gender for 75% of the males and 82% of the females. Here’s the table of actual and predicted gender counts:

Predicted Male Predicted Female Total
Actual Male 1,570 523 2,093
Actual Female 105 490 595
Total 1,675 1,013 2,688

Ranking the categories by gender preference

Another way to think about the categories’ relationship with gender is to calculate what I’ll call a “gender preference” for each category. The methodology for a single category is:

  1. Take each player’s performance in that category and adjust it by the player’s overall correct rate
    • E.g. the % of math questions I get correct minus the % of all questions I get correct
  2. Calculate the average of this value for each gender
  3. Take the difference between the male average and the female average
  4. The result is the category’s (male-female) preference, where a positive number indicates male preference, and a negative number indicates female preference

Calculating this number for each category produces a relatively easy to interpret graph that ranks categories from most “feminine” to “masculine”:

category preferences

The chart shows the difference between men and women’s average relative performance for each category. For example, women average 8.1% higher correct rate in theatre compared to their overall correct rate, and men average 5.5% worse correct rate in theatre compared to their overall average, so the difference is (-5.5 – 8.1) = -13.6%

Similar to the results from the decision tree, this methodology shows that theatre and food/drink are most indicative of female players, while games/sport and math are most associated with male players.

Data

The dataset and scripts I used for this post are available on GitHub. If you’re interested in LearnedLeague, this article provides a good overview, and you can always try your hand at a random selection of sample questions.

var baseDir = "/data/learnedleague/graphs/";

$("#category-x, #category-y").on("change", function() { var catX = $("#category-x").val(); var f = catX + "__" + $("#category-y").val() + ".png"; $("#ll-scatter").attr("src", baseDir + f); $("#ll-bar").attr("src", baseDir + catX + "_barplot.png"); }); });

To leave a comment for the author, please follow the link and comment on his blog: Category: R | Todd W. Schneider.

R-bloggers.com offers daily e-mail updates about R news and tutorials on topics such as: visualization (ggplot2, Boxplots, maps, animation), programming (RStudio, Sweave, LaTeX, SQL, Eclipse, git, hadoop, Web Scraping) statistics (regression, PCA, time series, trading) and more...

Waterfall plots – what and how?

$
0
0

(This article was first published on Design Data Decisions » R, and kindly contributed to R-bloggers)

Waterfall plots” are nowadays often used in oncology clinical trials for a graphical representation of the quantitative response of each subject to treatment. For an informative article explaining waterfall plots see Understanding Waterfall Plots.

In this post, we illustrate the creation of waterfall plots in R.

In a typical waterfall plot, the x-axis serves as the baseline value of the response variable. For each subject, vertical bars are drawn from the baseline, either in the positive or negative direction to depict the change from baseline in the response for the subject. The y-axis thus represents the change from baseline in the response, usually expressed as a percentage, for e.g., percent change in the size of the tumor or percent change in some marker level. Most importantly, in a waterfall plot, the bars are ordered in the decreasing order of the percent change values.

Though waterfall plots have gained popularity in oncology, they can be used for data visualization in other clinical trials as well, where the response is expressed as a change from baseline.

Dataset:

Instead of a tumor growth dataset, we illustrate creation of waterfall plots for the visual depiction of a quality of life data. A quality of life dataset, dataqol2 is available with the R package QoLR.

require(QoLR)
?dataqol2
data(dataqol2)
head(dataqol2)
dataqol2$id <- as.factor(dataqol2$id)
dataqol2$time <- as.factor(dataqol2$time)
dataqol2$arm <- as.factor(dataqol2$arm)

dataqol2 contains longitudinal data on scores for 2 quality of life measures (QoL and pain) for 60 subjects. In the case of QoL, higher scores are better since they imply better quality of life, and for pain, lower scores are better since they imply a decrease in pain. Each subject has these scores recorded at baseline (time = 0) and then at a maximum of 5 more time points post baseline. ‘arm’ represents the treatment arm to which the subjects were assigned. The dataset is in long format.

The rest of this post is on creating a waterfall plot in R for the QoL response variable.

Creating a waterfall plot using the barplot function in base R

The waterfall plot is basically an ‘ordered bar chart’, where each bar represents the change from baseline response measure for the corresponding subject.

As the first step, it would be helpful if we change the format of the dataset from ‘long’ to ‘wide’. We use the reshape function to do this. Also, we retain only the QoL scores, but not the pain scores:

qol2.wide <- reshape(dataqol2, v.names="QoL", idvar = "id", timevar = "time", direction = "wide", drop=c("date","pain"))

For each subject, we then find the best (largest) QoL score value post baseline, compute the best percentage change from baseline and order the dataframe in the decreasing order of the best percentage changes. We also remove subjects with missing percent change values:

qol2.wide$bestQoL <- apply(qol2.wide[,5:9], 1 ,function(x) ifelse(sum(!is.na(x)) == 0, NA, max(x,na.rm=TRUE)))
qol2.wide$bestQoL.PerChb <- ((qol2.wide$bestQoL-qol2.wide$QoL.0)/qol2.wide$QoL.0)*100

o <- order(qol2.wide$bestQoL.PerChb,decreasing=TRUE,na.last=NA)
qol2.wide <- qol2.wide[o,]

Create the waterfall plot… Finally!

barplot(qol2.wide$bestQoL.PerChb, col="blue", border="blue", space=0.5, ylim=c(-100,100),
main = "Waterfall plot for changes in QoL scores", ylab="Change from baseline (%) in QoL score",
cex.axis=1.2, cex.lab=1.4)

waterfall_base_Plain

Since we are depicting changes in quality of life scores, the higher the bar is in the positive direction, the better the improvement in the quality of life. So, the above figure shows that, for most subjects, there was improvement in the quality of life post baseline.

We can also color the bars differently by treatment arm, and include a legend. I used the choose_palette() function from the excellent colorspace R package to get some nice colors.

col <- ifelse(qol2.wide$arm == 0, "#BC5A42", "#009296")
barplot(qol2.wide$bestQoL.PerChb, col=col, border=col, space=0.5, ylim=c(-100,100),
main = "Waterfall plot for changes in QoL scores", ylab="Change from baseline (%) in QoL score",
cex.axis=1.2, cex.lab=1.4, legend.text=c(0,1),
args.legend=list(title="Treatment arm", fill=c("#BC5A42","#009296"), border=NA, cex=0.9))

waterfall_base_Tmnt

Treatment arm 1 is associated with the largest post baseline increases in the quality of life score. Since waterfall plots are basically bar charts, they can be colored by other relevant subject attributes as well.

The above is a solution to creating waterfall plots using base R graphics function barplot. It is my aim to simultaneously also develop a solution using the ggplot2 package (and in the process, develop expertise in ggplot2). So here it is…

Creating a waterfall plot using ggplot2

We use the previously created qol2.wide dataframe, but in ggplot2, we also need an x variable. So:

require(ggplot2)
x <- 1:nrow(qol2.wide)

Next we specify some plot settings, we color bars differently by treatment arm and allow the default colors of ggplot2, since I think they are quite nice. We also want to remove the x-axis, and put sensible limits for the y-axis:

b <- ggplot(qol2.wide, aes(x=x, y=bestQoL.PerChb, fill=arm, color=arm)) +
scale_fill_discrete(name="Treatmentnarm") + scale_color_discrete(guide="none") +
labs(list(title = "Waterfall plot for changes in QoL scores", x = NULL, y = "Change from baseline (%) in QoL score")) +
theme_classic() %+replace%
theme(axis.line.x = element_blank(), axis.text.x = element_blank(), axis.ticks.x = element_blank(),
axis.title.y = element_text(face="bold",angle=90)) +
coord_cartesian(ylim = c(-100,100))

Finally, the actual bars are drawn using geom_bar(), and we specify the width of the bars and the space between bars. We specify stat="identity" because we want the heights of the bars to represent actual values in the data. See ?geom_bar

 b <- b + geom_bar(stat="identity", width=0.7, position = position_dodge(width=0.4))

waterfall_ggplot2

To leave a comment for the author, please follow the link and comment on his blog: Design Data Decisions » R.

R-bloggers.com offers daily e-mail updates about R news and tutorials on topics such as: visualization (ggplot2, Boxplots, maps, animation), programming (RStudio, Sweave, LaTeX, SQL, Eclipse, git, hadoop, Web Scraping) statistics (regression, PCA, time series, trading) and more...
Viewing all 321 articles
Browse latest View live